Alaska Native vs Immigrants from Zaire Female Unemployment
COMPARE
Alaska Native
Immigrants from Zaire
Female Unemployment
Female Unemployment Comparison
Alaska Natives
Immigrants from Zaire
6.6%
FEMALE UNEMPLOYMENT
0.0/ 100
METRIC RATING
327th/ 347
METRIC RANK
5.0%
FEMALE UNEMPLOYMENT
95.2/ 100
METRIC RATING
99th/ 347
METRIC RANK
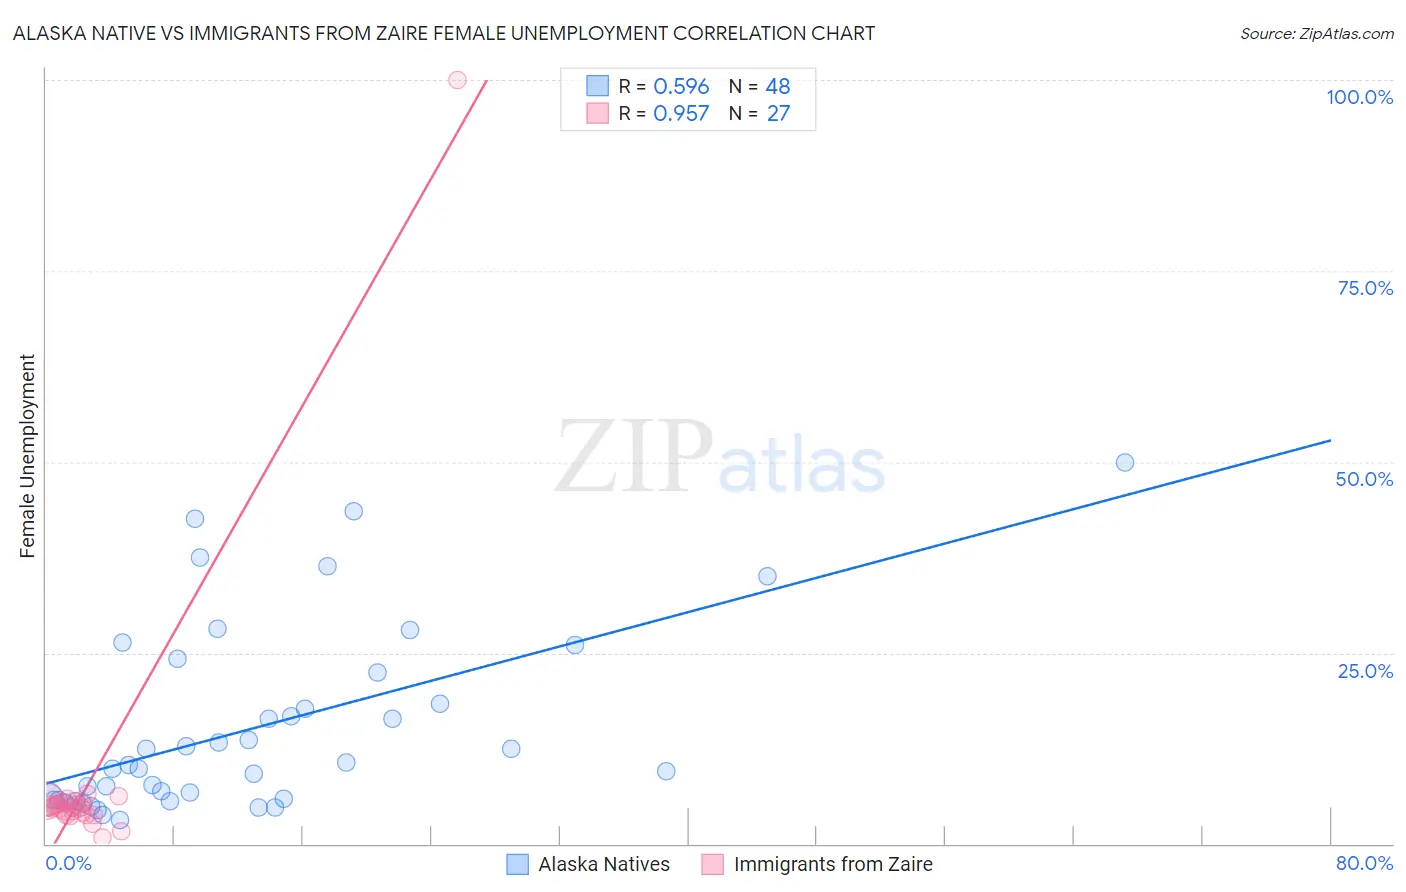
Alaska Native vs Immigrants from Zaire Female Unemployment Correlation Chart
The statistical analysis conducted on geographies consisting of 76,648,149 people shows a substantial positive correlation between the proportion of Alaska Natives and unemploymnet rate among females in the United States with a correlation coefficient (R) of 0.596 and weighted average of 6.6%. Similarly, the statistical analysis conducted on geographies consisting of 107,156,067 people shows a perfect positive correlation between the proportion of Immigrants from Zaire and unemploymnet rate among females in the United States with a correlation coefficient (R) of 0.957 and weighted average of 5.0%, a difference of 32.1%.
Female Unemployment Correlation Summary
| Measurement | Alaska Native | Immigrants from Zaire |
| Minimum | 3.1% | 0.80% |
| Maximum | 50.0% | 100.0% |
| Range | 46.9% | 99.2% |
| Mean | 15.0% | 8.0% |
| Median | 10.1% | 4.8% |
| Interquartile 25% (IQ1) | 5.7% | 3.8% |
| Interquartile 75% (IQ3) | 20.4% | 5.4% |
| Interquartile Range (IQR) | 14.7% | 1.6% |
| Standard Deviation (Sample) | 12.1% | 18.4% |
| Standard Deviation (Population) | 12.0% | 18.1% |
Similar Demographics by Female Unemployment
Demographics Similar to Alaska Natives by Female Unemployment
In terms of female unemployment, the demographic groups most similar to Alaska Natives are Native/Alaskan (6.6%, a difference of 0.090%), Guyanese (6.7%, a difference of 0.44%), Apache (6.6%, a difference of 0.64%), Immigrants from Guyana (6.7%, a difference of 0.80%), and Cheyenne (6.6%, a difference of 0.91%).
| Demographics | Rating | Rank | Female Unemployment |
| Immigrants | Dominica | 0.0 /100 | #320 | Tragic 6.5% |
| Blacks/African Americans | 0.0 /100 | #321 | Tragic 6.5% |
| Vietnamese | 0.0 /100 | #322 | Tragic 6.5% |
| Immigrants | Belize | 0.0 /100 | #323 | Tragic 6.5% |
| Cheyenne | 0.0 /100 | #324 | Tragic 6.6% |
| Apache | 0.0 /100 | #325 | Tragic 6.6% |
| Natives/Alaskans | 0.0 /100 | #326 | Tragic 6.6% |
| Alaska Natives | 0.0 /100 | #327 | Tragic 6.6% |
| Guyanese | 0.0 /100 | #328 | Tragic 6.7% |
| Immigrants | Guyana | 0.0 /100 | #329 | Tragic 6.7% |
| Yakama | 0.0 /100 | #330 | Tragic 6.7% |
| Paiute | 0.0 /100 | #331 | Tragic 6.8% |
| Sioux | 0.0 /100 | #332 | Tragic 7.0% |
| Menominee | 0.0 /100 | #333 | Tragic 7.0% |
| Immigrants | Armenia | 0.0 /100 | #334 | Tragic 7.1% |
Demographics Similar to Immigrants from Zaire by Female Unemployment
In terms of female unemployment, the demographic groups most similar to Immigrants from Zaire are Immigrants from Somalia (5.0%, a difference of 0.010%), Immigrants from Kuwait (5.0%, a difference of 0.010%), Indonesian (5.0%, a difference of 0.020%), Immigrants from Czechoslovakia (5.0%, a difference of 0.060%), and Immigrants from South Central Asia (5.0%, a difference of 0.12%).
| Demographics | Rating | Rank | Female Unemployment |
| Romanians | 95.9 /100 | #92 | Exceptional 5.0% |
| Immigrants | Austria | 95.7 /100 | #93 | Exceptional 5.0% |
| Immigrants | Malaysia | 95.7 /100 | #94 | Exceptional 5.0% |
| Burmese | 95.6 /100 | #95 | Exceptional 5.0% |
| Immigrants | South Central Asia | 95.5 /100 | #96 | Exceptional 5.0% |
| Immigrants | Somalia | 95.2 /100 | #97 | Exceptional 5.0% |
| Immigrants | Kuwait | 95.2 /100 | #98 | Exceptional 5.0% |
| Immigrants | Zaire | 95.2 /100 | #99 | Exceptional 5.0% |
| Indonesians | 95.1 /100 | #100 | Exceptional 5.0% |
| Immigrants | Czechoslovakia | 95.0 /100 | #101 | Exceptional 5.0% |
| Immigrants | Kenya | 94.8 /100 | #102 | Exceptional 5.0% |
| Somalis | 94.6 /100 | #103 | Exceptional 5.0% |
| Kenyans | 93.7 /100 | #104 | Exceptional 5.0% |
| Immigrants | England | 93.6 /100 | #105 | Exceptional 5.0% |
| Paraguayans | 93.2 /100 | #106 | Exceptional 5.1% |