Alaska Native vs Immigrants from Caribbean Married-Couple Family Poverty
COMPARE
Alaska Native
Immigrants from Caribbean
Married-Couple Family Poverty
Married-Couple Family Poverty Comparison
Alaska Natives
Immigrants from Caribbean
6.2%
MARRIED-COUPLE FAMILY POVERTY
0.2/ 100
METRIC RATING
268th/ 347
METRIC RANK
7.3%
MARRIED-COUPLE FAMILY POVERTY
0.0/ 100
METRIC RATING
321st/ 347
METRIC RANK
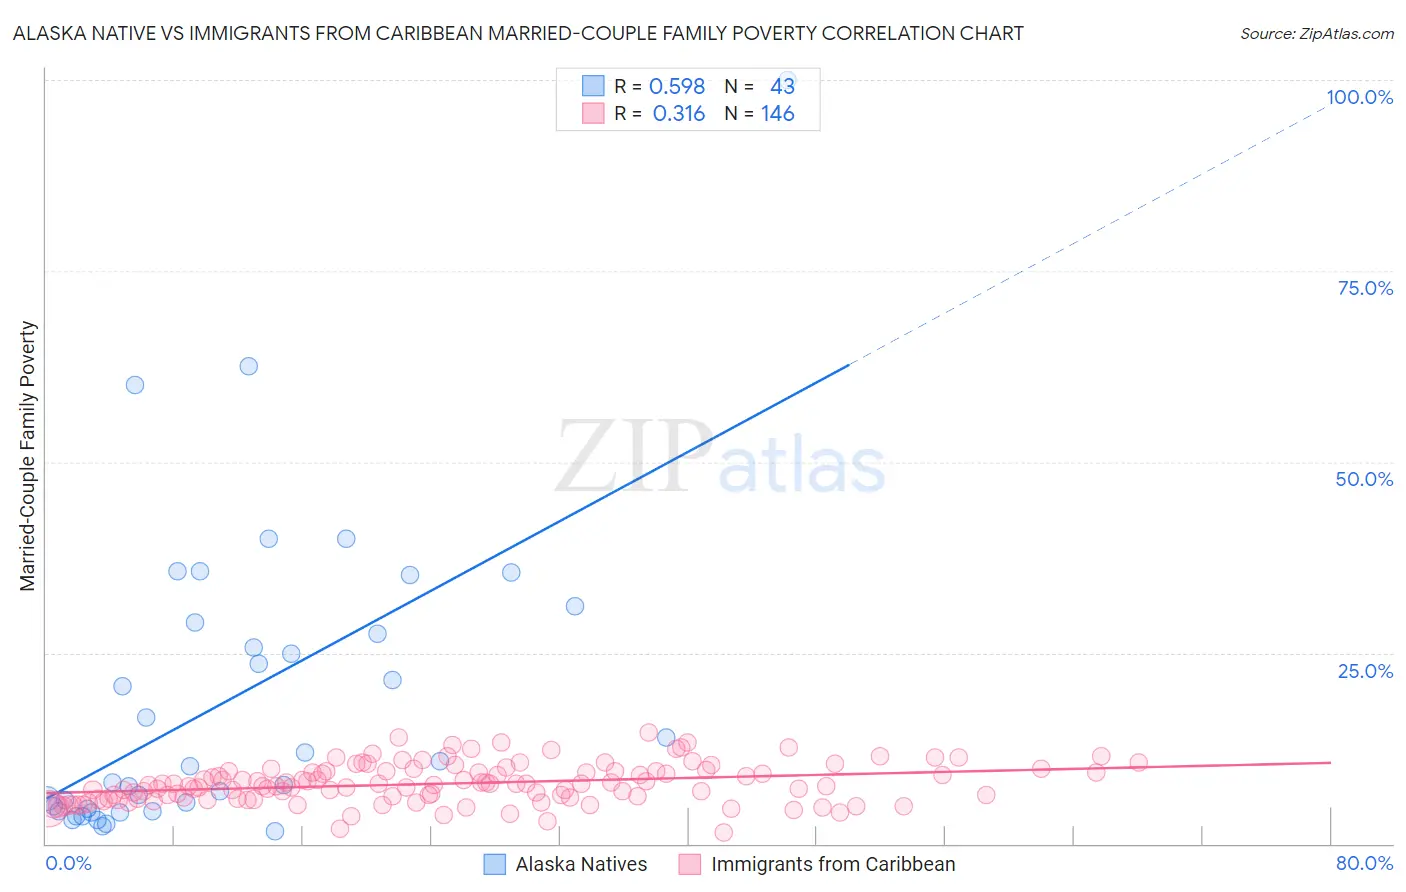
Alaska Native vs Immigrants from Caribbean Married-Couple Family Poverty Correlation Chart
The statistical analysis conducted on geographies consisting of 76,597,225 people shows a substantial positive correlation between the proportion of Alaska Natives and poverty level among married-couple families in the United States with a correlation coefficient (R) of 0.598 and weighted average of 6.2%. Similarly, the statistical analysis conducted on geographies consisting of 444,708,318 people shows a mild positive correlation between the proportion of Immigrants from Caribbean and poverty level among married-couple families in the United States with a correlation coefficient (R) of 0.316 and weighted average of 7.3%, a difference of 18.4%.
Married-Couple Family Poverty Correlation Summary
| Measurement | Alaska Native | Immigrants from Caribbean |
| Minimum | 1.6% | 1.5% |
| Maximum | 100.0% | 14.6% |
| Range | 98.4% | 13.1% |
| Mean | 18.9% | 7.9% |
| Median | 10.2% | 7.7% |
| Interquartile 25% (IQ1) | 4.3% | 5.9% |
| Interquartile 75% (IQ3) | 28.9% | 9.4% |
| Interquartile Range (IQR) | 24.6% | 3.5% |
| Standard Deviation (Sample) | 20.2% | 2.5% |
| Standard Deviation (Population) | 19.9% | 2.5% |
Similar Demographics by Married-Couple Family Poverty
Demographics Similar to Alaska Natives by Married-Couple Family Poverty
In terms of married-couple family poverty, the demographic groups most similar to Alaska Natives are Immigrants from West Indies (6.2%, a difference of 0.17%), Immigrants from Jamaica (6.2%, a difference of 0.21%), Immigrants from Bahamas (6.2%, a difference of 0.43%), Trinidadian and Tobagonian (6.2%, a difference of 0.46%), and Spanish American (6.2%, a difference of 0.48%).
| Demographics | Rating | Rank | Married-Couple Family Poverty |
| Senegalese | 0.3 /100 | #261 | Tragic 6.1% |
| Shoshone | 0.3 /100 | #262 | Tragic 6.1% |
| Immigrants | Senegal | 0.3 /100 | #263 | Tragic 6.1% |
| Immigrants | Congo | 0.2 /100 | #264 | Tragic 6.1% |
| Blackfeet | 0.2 /100 | #265 | Tragic 6.2% |
| Creek | 0.2 /100 | #266 | Tragic 6.2% |
| Spanish Americans | 0.2 /100 | #267 | Tragic 6.2% |
| Alaska Natives | 0.2 /100 | #268 | Tragic 6.2% |
| Immigrants | West Indies | 0.1 /100 | #269 | Tragic 6.2% |
| Immigrants | Jamaica | 0.1 /100 | #270 | Tragic 6.2% |
| Immigrants | Bahamas | 0.1 /100 | #271 | Tragic 6.2% |
| Trinidadians and Tobagonians | 0.1 /100 | #272 | Tragic 6.2% |
| Colville | 0.1 /100 | #273 | Tragic 6.3% |
| Barbadians | 0.1 /100 | #274 | Tragic 6.3% |
| Choctaw | 0.1 /100 | #275 | Tragic 6.3% |
Demographics Similar to Immigrants from Caribbean by Married-Couple Family Poverty
In terms of married-couple family poverty, the demographic groups most similar to Immigrants from Caribbean are Immigrants from Honduras (7.3%, a difference of 0.030%), Immigrants from Grenada (7.3%, a difference of 0.77%), Vietnamese (7.4%, a difference of 1.1%), Immigrants from Central America (7.4%, a difference of 1.2%), and Immigrants from Cuba (7.5%, a difference of 1.7%).
| Demographics | Rating | Rank | Married-Couple Family Poverty |
| British West Indians | 0.0 /100 | #314 | Tragic 7.1% |
| Inupiat | 0.0 /100 | #315 | Tragic 7.1% |
| Hondurans | 0.0 /100 | #316 | Tragic 7.2% |
| Mexicans | 0.0 /100 | #317 | Tragic 7.2% |
| Immigrants | Guatemala | 0.0 /100 | #318 | Tragic 7.2% |
| Immigrants | Latin America | 0.0 /100 | #319 | Tragic 7.2% |
| Immigrants | Grenada | 0.0 /100 | #320 | Tragic 7.3% |
| Immigrants | Caribbean | 0.0 /100 | #321 | Tragic 7.3% |
| Immigrants | Honduras | 0.0 /100 | #322 | Tragic 7.3% |
| Vietnamese | 0.0 /100 | #323 | Tragic 7.4% |
| Immigrants | Central America | 0.0 /100 | #324 | Tragic 7.4% |
| Immigrants | Cuba | 0.0 /100 | #325 | Tragic 7.5% |
| Immigrants | Bangladesh | 0.0 /100 | #326 | Tragic 7.5% |
| Hispanics or Latinos | 0.0 /100 | #327 | Tragic 7.5% |
| Immigrants | Mexico | 0.0 /100 | #328 | Tragic 7.6% |