Immigrants from Iraq vs Immigrants from Zaire Married-Couple Family Poverty
COMPARE
Immigrants from Iraq
Immigrants from Zaire
Married-Couple Family Poverty
Married-Couple Family Poverty Comparison
Immigrants from Iraq
Immigrants from Zaire
5.7%
MARRIED-COUPLE FAMILY POVERTY
4.4/ 100
METRIC RATING
231st/ 347
METRIC RANK
5.6%
MARRIED-COUPLE FAMILY POVERTY
5.6/ 100
METRIC RATING
227th/ 347
METRIC RANK
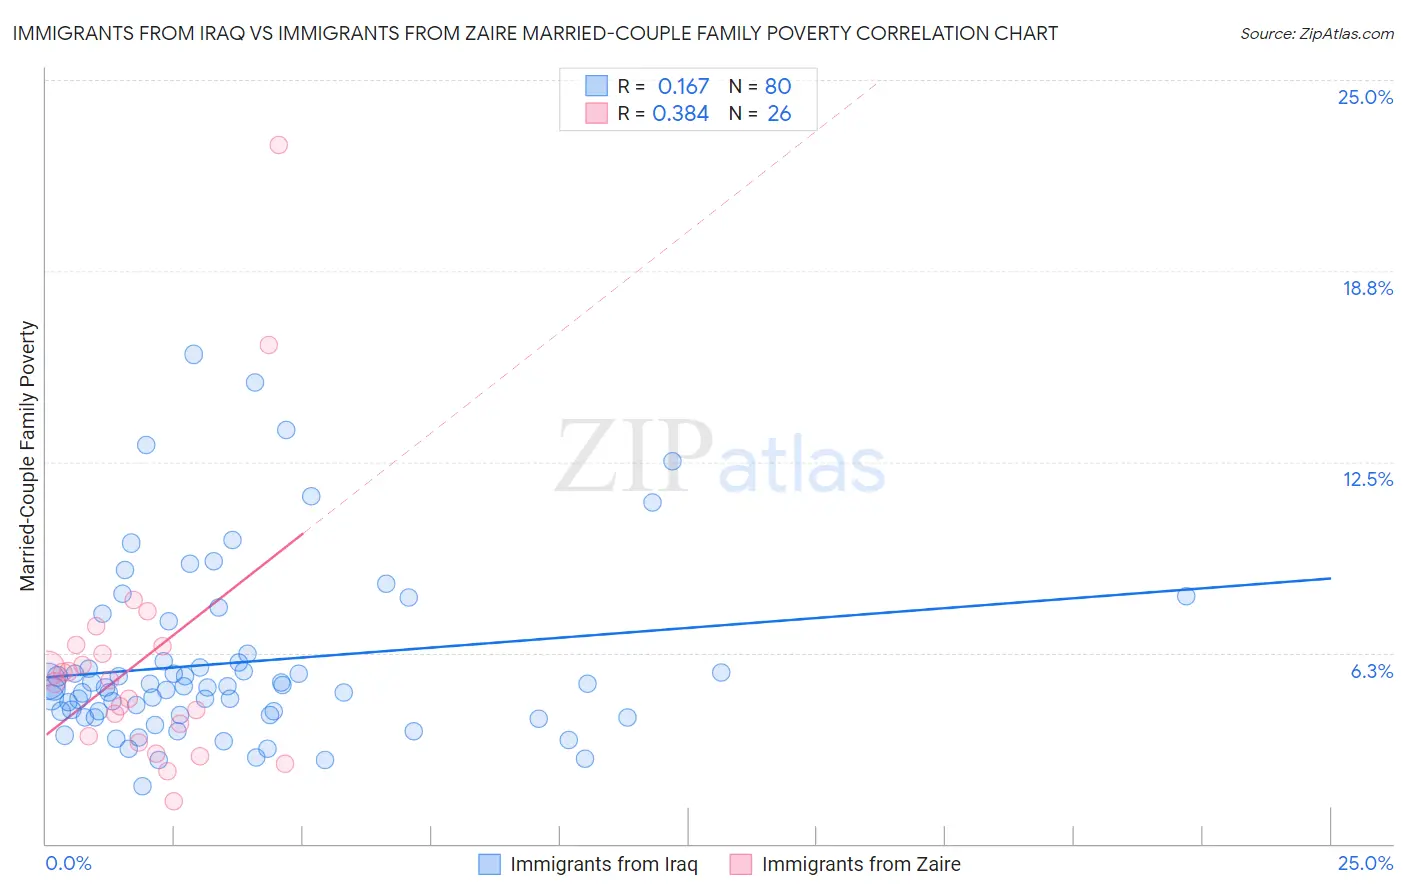
Immigrants from Iraq vs Immigrants from Zaire Married-Couple Family Poverty Correlation Chart
The statistical analysis conducted on geographies consisting of 194,160,466 people shows a poor positive correlation between the proportion of Immigrants from Iraq and poverty level among married-couple families in the United States with a correlation coefficient (R) of 0.167 and weighted average of 5.7%. Similarly, the statistical analysis conducted on geographies consisting of 106,970,215 people shows a mild positive correlation between the proportion of Immigrants from Zaire and poverty level among married-couple families in the United States with a correlation coefficient (R) of 0.384 and weighted average of 5.6%, a difference of 0.68%.
Married-Couple Family Poverty Correlation Summary
| Measurement | Immigrants from Iraq | Immigrants from Zaire |
| Minimum | 1.9% | 1.4% |
| Maximum | 16.0% | 22.9% |
| Range | 14.2% | 21.5% |
| Mean | 5.9% | 6.0% |
| Median | 5.1% | 5.3% |
| Interquartile 25% (IQ1) | 4.2% | 3.5% |
| Interquartile 75% (IQ3) | 6.1% | 6.5% |
| Interquartile Range (IQR) | 1.9% | 3.0% |
| Standard Deviation (Sample) | 2.9% | 4.4% |
| Standard Deviation (Population) | 2.9% | 4.4% |
Demographics Similar to Immigrants from Iraq and Immigrants from Zaire by Married-Couple Family Poverty
In terms of married-couple family poverty, the demographic groups most similar to Immigrants from Iraq are Immigrants from Laos (5.7%, a difference of 0.060%), Moroccan (5.7%, a difference of 0.26%), Subsaharan African (5.7%, a difference of 0.29%), Immigrants from Colombia (5.7%, a difference of 0.49%), and Immigrants from Uruguay (5.7%, a difference of 0.50%). Similarly, the demographic groups most similar to Immigrants from Zaire are South American (5.6%, a difference of 0.020%), Arab (5.7%, a difference of 0.13%), Immigrants from Cambodia (5.6%, a difference of 0.24%), Sudanese (5.6%, a difference of 0.38%), and Subsaharan African (5.7%, a difference of 0.38%).
| Demographics | Rating | Rank | Married-Couple Family Poverty |
| Japanese | 9.8 /100 | #219 | Tragic 5.6% |
| Colombians | 9.2 /100 | #220 | Tragic 5.6% |
| Panamanians | 9.2 /100 | #221 | Tragic 5.6% |
| Cajuns | 6.9 /100 | #222 | Tragic 5.6% |
| Immigrants | Fiji | 6.7 /100 | #223 | Tragic 5.6% |
| Sudanese | 6.4 /100 | #224 | Tragic 5.6% |
| Immigrants | Cambodia | 6.1 /100 | #225 | Tragic 5.6% |
| South Americans | 5.7 /100 | #226 | Tragic 5.6% |
| Immigrants | Zaire | 5.6 /100 | #227 | Tragic 5.6% |
| Arabs | 5.4 /100 | #228 | Tragic 5.7% |
| Sub-Saharan Africans | 4.9 /100 | #229 | Tragic 5.7% |
| Moroccans | 4.9 /100 | #230 | Tragic 5.7% |
| Immigrants | Iraq | 4.4 /100 | #231 | Tragic 5.7% |
| Immigrants | Laos | 4.4 /100 | #232 | Tragic 5.7% |
| Immigrants | Colombia | 3.7 /100 | #233 | Tragic 5.7% |
| Immigrants | Uruguay | 3.7 /100 | #234 | Tragic 5.7% |
| Immigrants | Sudan | 3.5 /100 | #235 | Tragic 5.7% |
| Ghanaians | 3.3 /100 | #236 | Tragic 5.7% |
| Immigrants | South America | 3.1 /100 | #237 | Tragic 5.7% |
| Cherokee | 2.7 /100 | #238 | Tragic 5.8% |
| Venezuelans | 2.7 /100 | #239 | Tragic 5.8% |