Zip Codes with the Highest Percentage of Population Employed in Health Diagnosing & Treating in Allentown, PA
RELATED REPORTS & OPTIONS
Health Diagnosing & Treating
Allentown
Compare Zip Codes
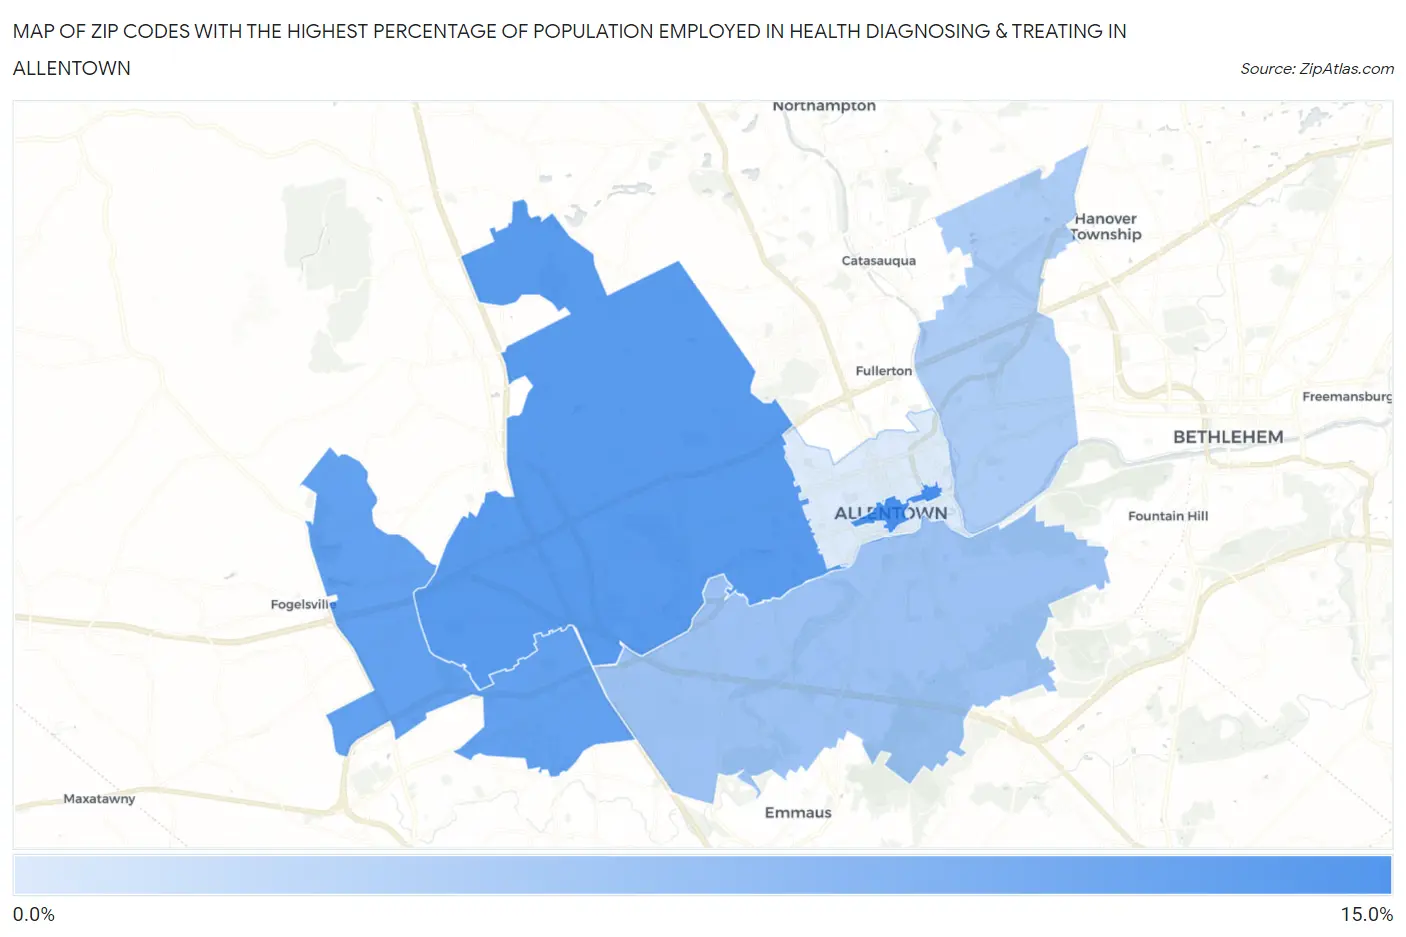
Map of Zip Codes with the Highest Percentage of Population Employed in Health Diagnosing & Treating in Allentown
2.7%
10.0%
Zip Codes with the Highest Percentage of Population Employed in Health Diagnosing & Treating in Allentown, PA
| Zip Code | % Employed | vs State | vs National | |
| 1. | 18101 | 10.0% | 7.4%(+2.66)#293 | 6.2%(+3.76)#3,877 |
| 2. | 18104 | 9.2% | 7.4%(+1.89)#365 | 6.2%(+3.00)#4,961 |
| 3. | 18106 | 8.6% | 7.4%(+1.23)#453 | 6.2%(+2.33)#6,169 |
| 4. | 18103 | 5.8% | 7.4%(-1.50)#989 | 6.2%(-0.399)#14,436 |
| 5. | 18109 | 5.1% | 7.4%(-2.29)#1,155 | 6.2%(-1.18)#17,439 |
| 6. | 18102 | 2.7% | 7.4%(-4.64)#1,456 | 6.2%(-3.53)#25,018 |
1
Common Questions
What are the Top 5 Zip Codes with the Highest Percentage of Population Employed in Health Diagnosing & Treating in Allentown, PA?
Top 5 Zip Codes with the Highest Percentage of Population Employed in Health Diagnosing & Treating in Allentown, PA are:
What zip code has the Highest Percentage of Population Employed in Health Diagnosing & Treating in Allentown, PA?
18101 has the Highest Percentage of Population Employed in Health Diagnosing & Treating in Allentown, PA with 10.0%.
What is the Percentage of Population Employed in Health Diagnosing & Treating in Allentown, PA?
Percentage of Population Employed in Health Diagnosing & Treating in Allentown is 3.9%.
What is the Percentage of Population Employed in Health Diagnosing & Treating in Pennsylvania?
Percentage of Population Employed in Health Diagnosing & Treating in Pennsylvania is 7.4%.
What is the Percentage of Population Employed in Health Diagnosing & Treating in the United States?
Percentage of Population Employed in Health Diagnosing & Treating in the United States is 6.2%.