Zip Codes with the Highest Percentage of Population with a Degree in Liberal Arts and History in Rockville, MD
RELATED REPORTS & OPTIONS
Liberal Arts and History
Rockville
Compare Zip Codes
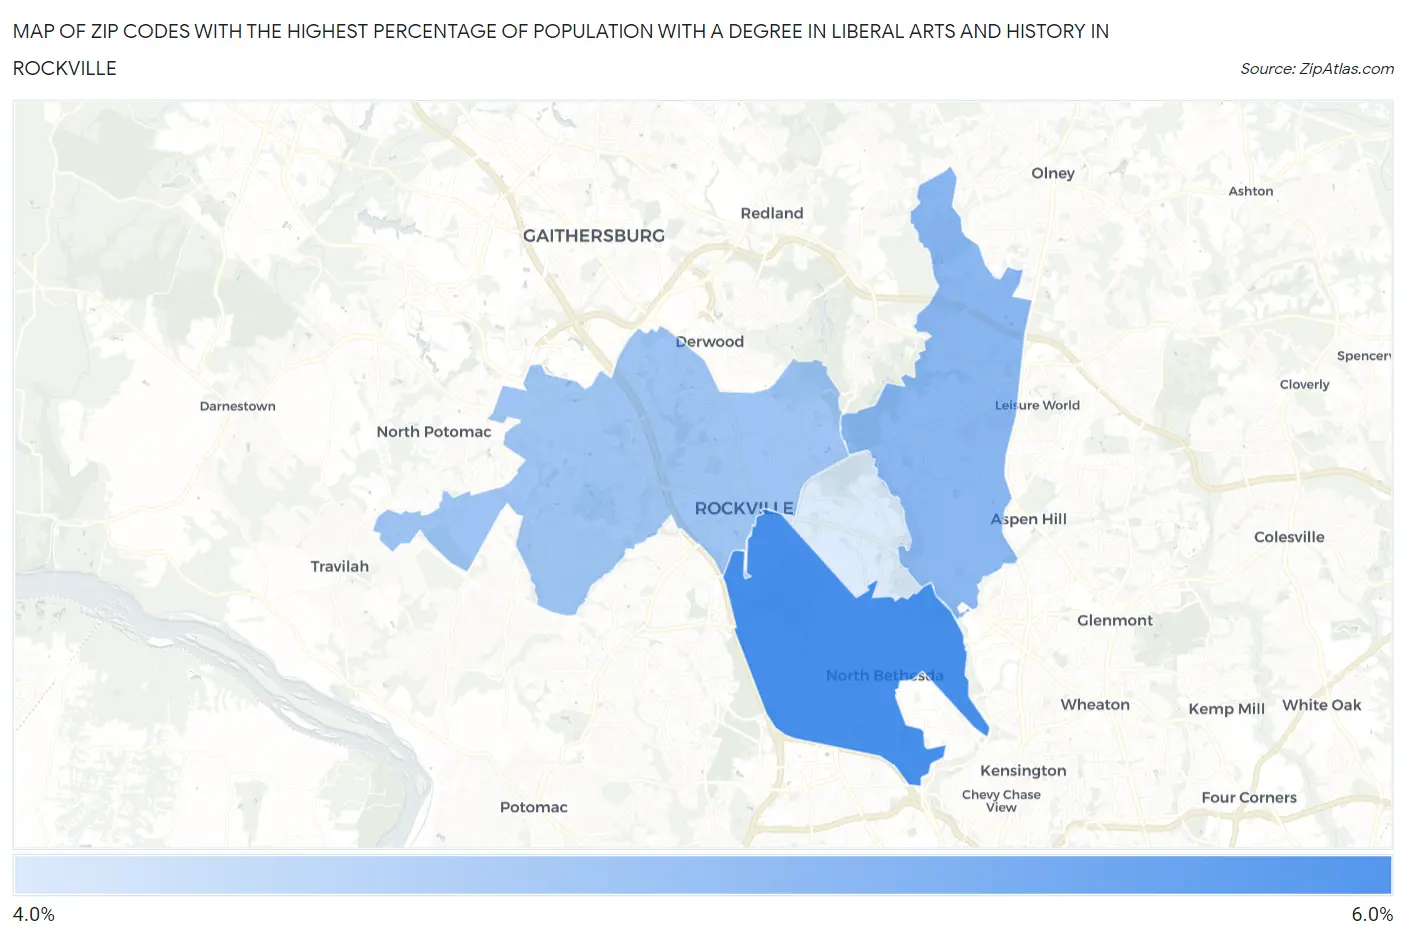
Map of Zip Codes with the Highest Percentage of Population with a Degree in Liberal Arts and History in Rockville
4.2%
5.3%
Zip Codes with the Highest Percentage of Population with a Degree in Liberal Arts and History in Rockville, MD
| Zip Code | % Graduates | vs State | vs National | |
| 1. | 20852 | 5.3% | 5.0%(+0.284)#178 | 4.9%(+0.446)#10,388 |
| 2. | 20853 | 4.8% | 5.0%(-0.214)#198 | 4.9%(-0.052)#11,916 |
| 3. | 20850 | 4.7% | 5.0%(-0.368)#212 | 4.9%(-0.206)#12,440 |
| 4. | 20851 | 4.2% | 5.0%(-0.832)#235 | 4.9%(-0.670)#14,008 |
1
Common Questions
What are the Top 3 Zip Codes with the Highest Percentage of Population with a Degree in Liberal Arts and History in Rockville, MD?
Top 3 Zip Codes with the Highest Percentage of Population with a Degree in Liberal Arts and History in Rockville, MD are:
What zip code has the Highest Percentage of Population with a Degree in Liberal Arts and History in Rockville, MD?
20852 has the Highest Percentage of Population with a Degree in Liberal Arts and History in Rockville, MD with 5.3%.
What is the Percentage of Population with a Degree in Liberal Arts and History in Rockville, MD?
Percentage of Population with a Degree in Liberal Arts and History in Rockville is 5.1%.
What is the Percentage of Population with a Degree in Liberal Arts and History in Maryland?
Percentage of Population with a Degree in Liberal Arts and History in Maryland is 5.0%.
What is the Percentage of Population with a Degree in Liberal Arts and History in the United States?
Percentage of Population with a Degree in Liberal Arts and History in the United States is 4.9%.