Zip Codes with the Highest Percentage of Population with a Degree in Liberal Arts and History in Bethesda, MD
RELATED REPORTS & OPTIONS
Liberal Arts and History
Bethesda
Compare Zip Codes
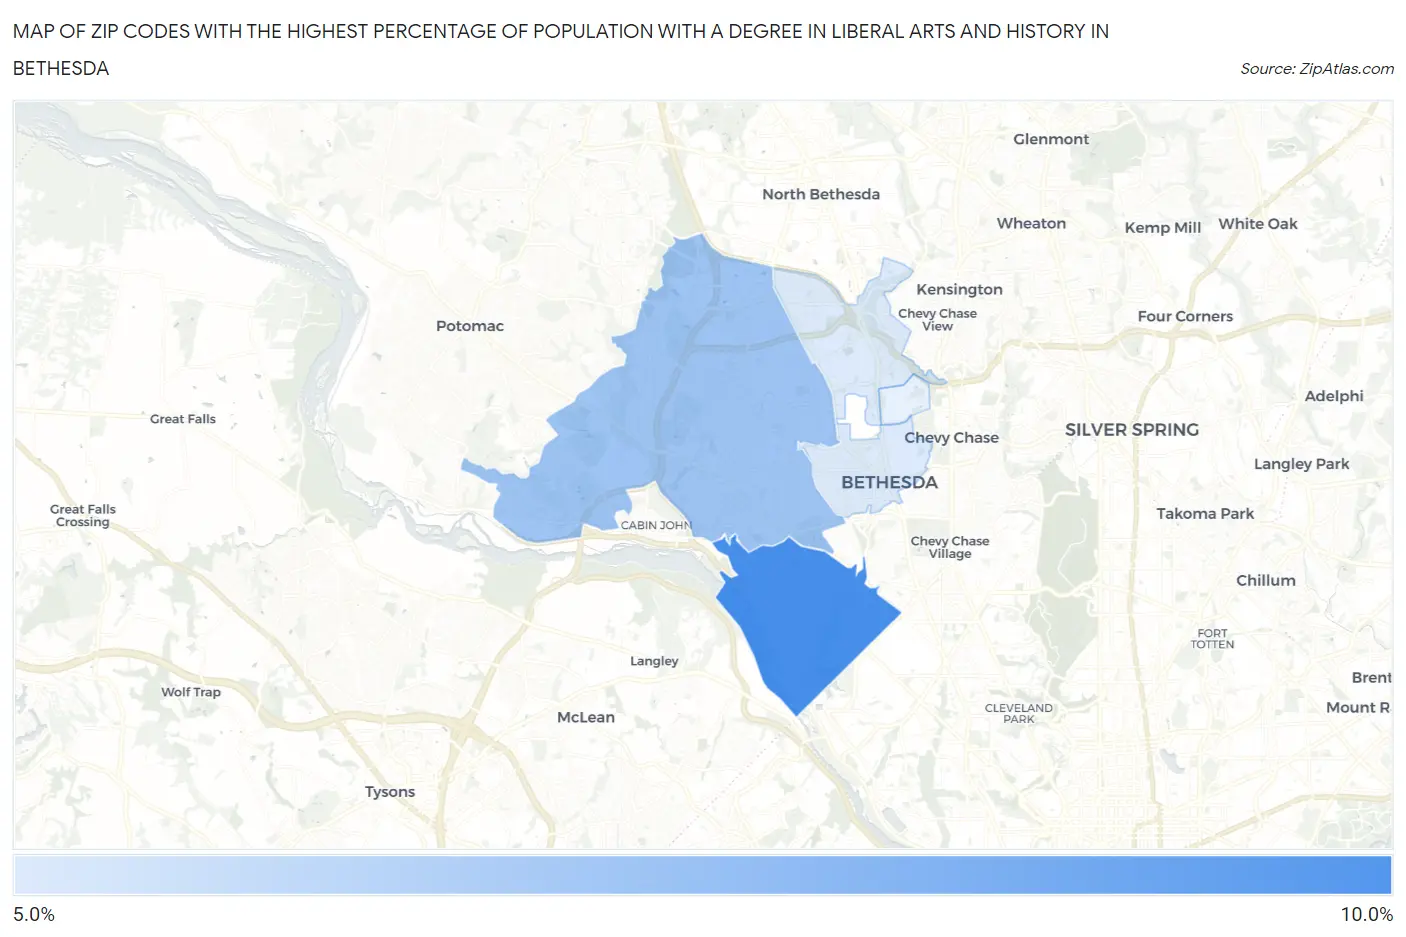
Map of Zip Codes with the Highest Percentage of Population with a Degree in Liberal Arts and History in Bethesda
5.6%
9.4%
Zip Codes with the Highest Percentage of Population with a Degree in Liberal Arts and History in Bethesda, MD
| Zip Code | % Graduates | vs State | vs National | |
| 1. | 20816 | 9.4% | 5.0%(+4.36)#61 | 4.9%(+4.52)#3,531 |
| 2. | 20817 | 7.2% | 5.0%(+2.14)#95 | 4.9%(+2.30)#6,088 |
| 3. | 20814 | 5.6% | 5.0%(+0.567)#164 | 4.9%(+0.729)#9,565 |
1
Common Questions
What are the Top 3 Zip Codes with the Highest Percentage of Population with a Degree in Liberal Arts and History in Bethesda, MD?
Top 3 Zip Codes with the Highest Percentage of Population with a Degree in Liberal Arts and History in Bethesda, MD are:
What zip code has the Highest Percentage of Population with a Degree in Liberal Arts and History in Bethesda, MD?
20816 has the Highest Percentage of Population with a Degree in Liberal Arts and History in Bethesda, MD with 9.4%.
What is the Percentage of Population with a Degree in Liberal Arts and History in Bethesda, MD?
Percentage of Population with a Degree in Liberal Arts and History in Bethesda is 7.7%.
What is the Percentage of Population with a Degree in Liberal Arts and History in Maryland?
Percentage of Population with a Degree in Liberal Arts and History in Maryland is 5.0%.
What is the Percentage of Population with a Degree in Liberal Arts and History in the United States?
Percentage of Population with a Degree in Liberal Arts and History in the United States is 4.9%.