Assyrian/Chaldean/Syriac vs Immigrants from Canada Median Family Income
COMPARE
Assyrian/Chaldean/Syriac
Immigrants from Canada
Median Family Income
Median Family Income Comparison
Assyrians/Chaldeans/Syriacs
Immigrants from Canada
$109,622
MEDIAN FAMILY INCOME
97.2/ 100
METRIC RATING
102nd/ 347
METRIC RANK
$112,374
MEDIAN FAMILY INCOME
99.3/ 100
METRIC RATING
78th/ 347
METRIC RANK
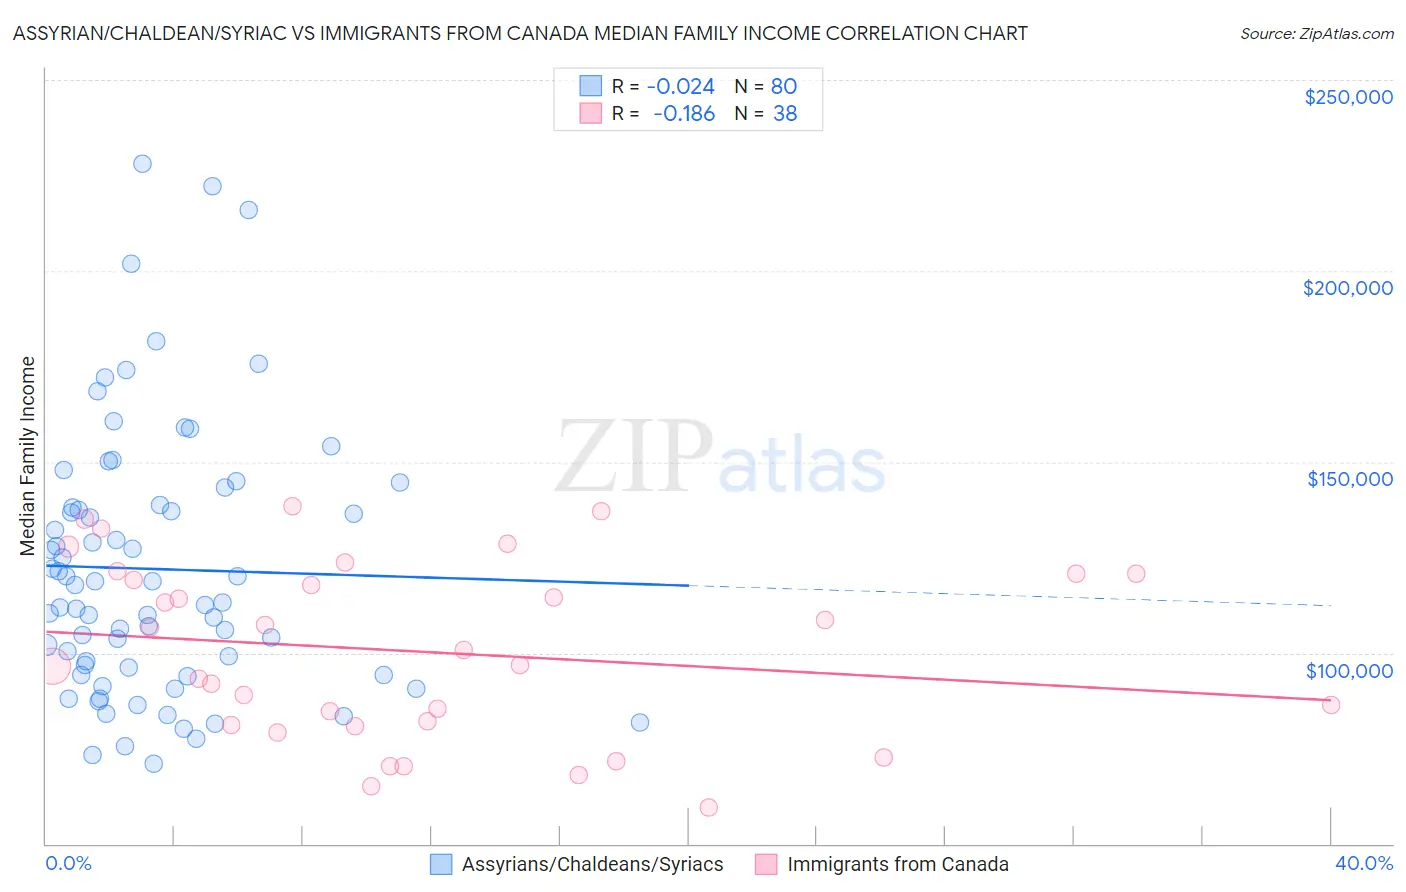
Assyrian/Chaldean/Syriac vs Immigrants from Canada Median Family Income Correlation Chart
The statistical analysis conducted on geographies consisting of 110,249,217 people shows no correlation between the proportion of Assyrians/Chaldeans/Syriacs and median family income in the United States with a correlation coefficient (R) of -0.024 and weighted average of $109,622. Similarly, the statistical analysis conducted on geographies consisting of 458,941,757 people shows a poor negative correlation between the proportion of Immigrants from Canada and median family income in the United States with a correlation coefficient (R) of -0.186 and weighted average of $112,374, a difference of 2.5%.
Median Family Income Correlation Summary
| Measurement | Assyrian/Chaldean/Syriac | Immigrants from Canada |
| Minimum | $71,012 | $59,444 |
| Maximum | $228,043 | $138,302 |
| Range | $157,031 | $78,858 |
| Mean | $121,955 | $100,298 |
| Median | $115,499 | $98,848 |
| Interquartile 25% (IQ1) | $95,222 | $81,159 |
| Interquartile 75% (IQ3) | $138,288 | $120,729 |
| Interquartile Range (IQR) | $43,065 | $39,570 |
| Standard Deviation (Sample) | $34,820 | $23,025 |
| Standard Deviation (Population) | $34,602 | $22,720 |
Similar Demographics by Median Family Income
Demographics Similar to Assyrians/Chaldeans/Syriacs by Median Family Income
In terms of median family income, the demographic groups most similar to Assyrians/Chaldeans/Syriacs are Immigrants from Ukraine ($109,645, a difference of 0.020%), Macedonian ($109,668, a difference of 0.040%), Armenian ($109,692, a difference of 0.060%), Immigrants from Kuwait ($109,731, a difference of 0.10%), and Immigrants from Brazil ($109,418, a difference of 0.19%).
| Demographics | Rating | Rank | Median Family Income |
| Zimbabweans | 97.7 /100 | #95 | Exceptional $110,011 |
| Immigrants | Moldova | 97.7 /100 | #96 | Exceptional $109,975 |
| Jordanians | 97.5 /100 | #97 | Exceptional $109,865 |
| Immigrants | Kuwait | 97.4 /100 | #98 | Exceptional $109,731 |
| Armenians | 97.3 /100 | #99 | Exceptional $109,692 |
| Macedonians | 97.3 /100 | #100 | Exceptional $109,668 |
| Immigrants | Ukraine | 97.2 /100 | #101 | Exceptional $109,645 |
| Assyrians/Chaldeans/Syriacs | 97.2 /100 | #102 | Exceptional $109,622 |
| Immigrants | Brazil | 96.9 /100 | #103 | Exceptional $109,418 |
| Palestinians | 96.9 /100 | #104 | Exceptional $109,413 |
| Syrians | 96.7 /100 | #105 | Exceptional $109,299 |
| Albanians | 96.4 /100 | #106 | Exceptional $109,136 |
| Immigrants | North Macedonia | 96.4 /100 | #107 | Exceptional $109,136 |
| Immigrants | Zimbabwe | 95.9 /100 | #108 | Exceptional $108,830 |
| Immigrants | Afghanistan | 95.6 /100 | #109 | Exceptional $108,709 |
Demographics Similar to Immigrants from Canada by Median Family Income
In terms of median family income, the demographic groups most similar to Immigrants from Canada are Italian ($112,372, a difference of 0.0%), Immigrants from Croatia ($112,323, a difference of 0.050%), Immigrants from Eastern Europe ($112,527, a difference of 0.14%), Immigrants from North America ($112,151, a difference of 0.20%), and Argentinean ($112,665, a difference of 0.26%).
| Demographics | Rating | Rank | Median Family Income |
| South Africans | 99.5 /100 | #71 | Exceptional $113,229 |
| Afghans | 99.5 /100 | #72 | Exceptional $112,971 |
| Laotians | 99.5 /100 | #73 | Exceptional $112,859 |
| Immigrants | Italy | 99.4 /100 | #74 | Exceptional $112,848 |
| Immigrants | Western Europe | 99.4 /100 | #75 | Exceptional $112,688 |
| Argentineans | 99.4 /100 | #76 | Exceptional $112,665 |
| Immigrants | Eastern Europe | 99.4 /100 | #77 | Exceptional $112,527 |
| Immigrants | Canada | 99.3 /100 | #78 | Exceptional $112,374 |
| Italians | 99.3 /100 | #79 | Exceptional $112,372 |
| Immigrants | Croatia | 99.3 /100 | #80 | Exceptional $112,323 |
| Immigrants | North America | 99.2 /100 | #81 | Exceptional $112,151 |
| Immigrants | England | 99.2 /100 | #82 | Exceptional $112,038 |
| Immigrants | Egypt | 99.0 /100 | #83 | Exceptional $111,689 |
| Immigrants | Hungary | 98.8 /100 | #84 | Exceptional $111,378 |
| Croatians | 98.8 /100 | #85 | Exceptional $111,370 |