Assyrian/Chaldean/Syriac vs Immigrants from Eastern Africa Median Family Income
COMPARE
Assyrian/Chaldean/Syriac
Immigrants from Eastern Africa
Median Family Income
Median Family Income Comparison
Assyrians/Chaldeans/Syriacs
Immigrants from Eastern Africa
$109,622
MEDIAN FAMILY INCOME
97.2/ 100
METRIC RATING
102nd/ 347
METRIC RANK
$102,451
MEDIAN FAMILY INCOME
47.1/ 100
METRIC RATING
175th/ 347
METRIC RANK
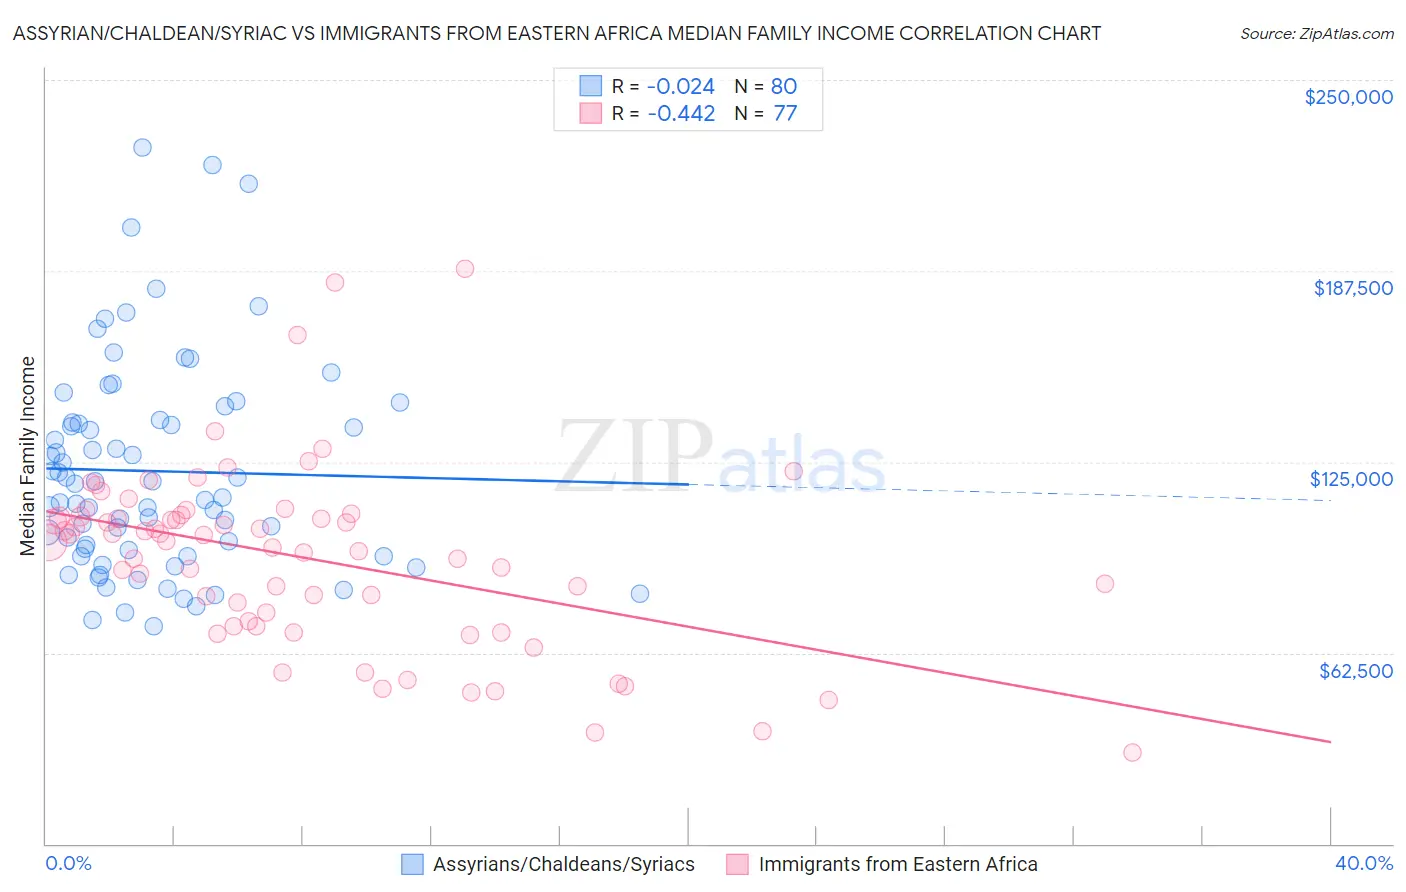
Assyrian/Chaldean/Syriac vs Immigrants from Eastern Africa Median Family Income Correlation Chart
The statistical analysis conducted on geographies consisting of 110,249,217 people shows no correlation between the proportion of Assyrians/Chaldeans/Syriacs and median family income in the United States with a correlation coefficient (R) of -0.024 and weighted average of $109,622. Similarly, the statistical analysis conducted on geographies consisting of 354,805,172 people shows a moderate negative correlation between the proportion of Immigrants from Eastern Africa and median family income in the United States with a correlation coefficient (R) of -0.442 and weighted average of $102,451, a difference of 7.0%.
Median Family Income Correlation Summary
| Measurement | Assyrian/Chaldean/Syriac | Immigrants from Eastern Africa |
| Minimum | $71,012 | $29,978 |
| Maximum | $228,043 | $188,047 |
| Range | $157,031 | $158,069 |
| Mean | $121,955 | $93,590 |
| Median | $115,499 | $99,122 |
| Interquartile 25% (IQ1) | $95,222 | $71,998 |
| Interquartile 75% (IQ3) | $138,288 | $107,333 |
| Interquartile Range (IQR) | $43,065 | $35,335 |
| Standard Deviation (Sample) | $34,820 | $29,714 |
| Standard Deviation (Population) | $34,602 | $29,520 |
Similar Demographics by Median Family Income
Demographics Similar to Assyrians/Chaldeans/Syriacs by Median Family Income
In terms of median family income, the demographic groups most similar to Assyrians/Chaldeans/Syriacs are Immigrants from Ukraine ($109,645, a difference of 0.020%), Macedonian ($109,668, a difference of 0.040%), Armenian ($109,692, a difference of 0.060%), Immigrants from Kuwait ($109,731, a difference of 0.10%), and Immigrants from Brazil ($109,418, a difference of 0.19%).
| Demographics | Rating | Rank | Median Family Income |
| Zimbabweans | 97.7 /100 | #95 | Exceptional $110,011 |
| Immigrants | Moldova | 97.7 /100 | #96 | Exceptional $109,975 |
| Jordanians | 97.5 /100 | #97 | Exceptional $109,865 |
| Immigrants | Kuwait | 97.4 /100 | #98 | Exceptional $109,731 |
| Armenians | 97.3 /100 | #99 | Exceptional $109,692 |
| Macedonians | 97.3 /100 | #100 | Exceptional $109,668 |
| Immigrants | Ukraine | 97.2 /100 | #101 | Exceptional $109,645 |
| Assyrians/Chaldeans/Syriacs | 97.2 /100 | #102 | Exceptional $109,622 |
| Immigrants | Brazil | 96.9 /100 | #103 | Exceptional $109,418 |
| Palestinians | 96.9 /100 | #104 | Exceptional $109,413 |
| Syrians | 96.7 /100 | #105 | Exceptional $109,299 |
| Albanians | 96.4 /100 | #106 | Exceptional $109,136 |
| Immigrants | North Macedonia | 96.4 /100 | #107 | Exceptional $109,136 |
| Immigrants | Zimbabwe | 95.9 /100 | #108 | Exceptional $108,830 |
| Immigrants | Afghanistan | 95.6 /100 | #109 | Exceptional $108,709 |
Demographics Similar to Immigrants from Eastern Africa by Median Family Income
In terms of median family income, the demographic groups most similar to Immigrants from Eastern Africa are French ($102,368, a difference of 0.080%), German ($102,254, a difference of 0.19%), Finnish ($102,676, a difference of 0.22%), Welsh ($102,151, a difference of 0.29%), and Belgian ($102,788, a difference of 0.33%).
| Demographics | Rating | Rank | Median Family Income |
| Immigrants | Peru | 60.8 /100 | #168 | Good $103,534 |
| Czechoslovakians | 57.6 /100 | #169 | Average $103,273 |
| Immigrants | Uzbekistan | 56.6 /100 | #170 | Average $103,197 |
| Alsatians | 54.3 /100 | #171 | Average $103,010 |
| Immigrants | Eritrea | 51.9 /100 | #172 | Average $102,823 |
| Belgians | 51.4 /100 | #173 | Average $102,788 |
| Finns | 50.0 /100 | #174 | Average $102,676 |
| Immigrants | Eastern Africa | 47.1 /100 | #175 | Average $102,451 |
| French | 46.1 /100 | #176 | Average $102,368 |
| Germans | 44.6 /100 | #177 | Average $102,254 |
| Welsh | 43.3 /100 | #178 | Average $102,151 |
| South Americans | 39.7 /100 | #179 | Fair $101,856 |
| French Canadians | 37.0 /100 | #180 | Fair $101,634 |
| Spaniards | 36.8 /100 | #181 | Fair $101,617 |
| Tsimshian | 35.9 /100 | #182 | Fair $101,543 |