Assyrian/Chaldean/Syriac vs Armenian Median Family Income
COMPARE
Assyrian/Chaldean/Syriac
Armenian
Median Family Income
Median Family Income Comparison
Assyrians/Chaldeans/Syriacs
Armenians
$109,622
MEDIAN FAMILY INCOME
97.2/ 100
METRIC RATING
102nd/ 347
METRIC RANK
$109,692
MEDIAN FAMILY INCOME
97.3/ 100
METRIC RATING
99th/ 347
METRIC RANK
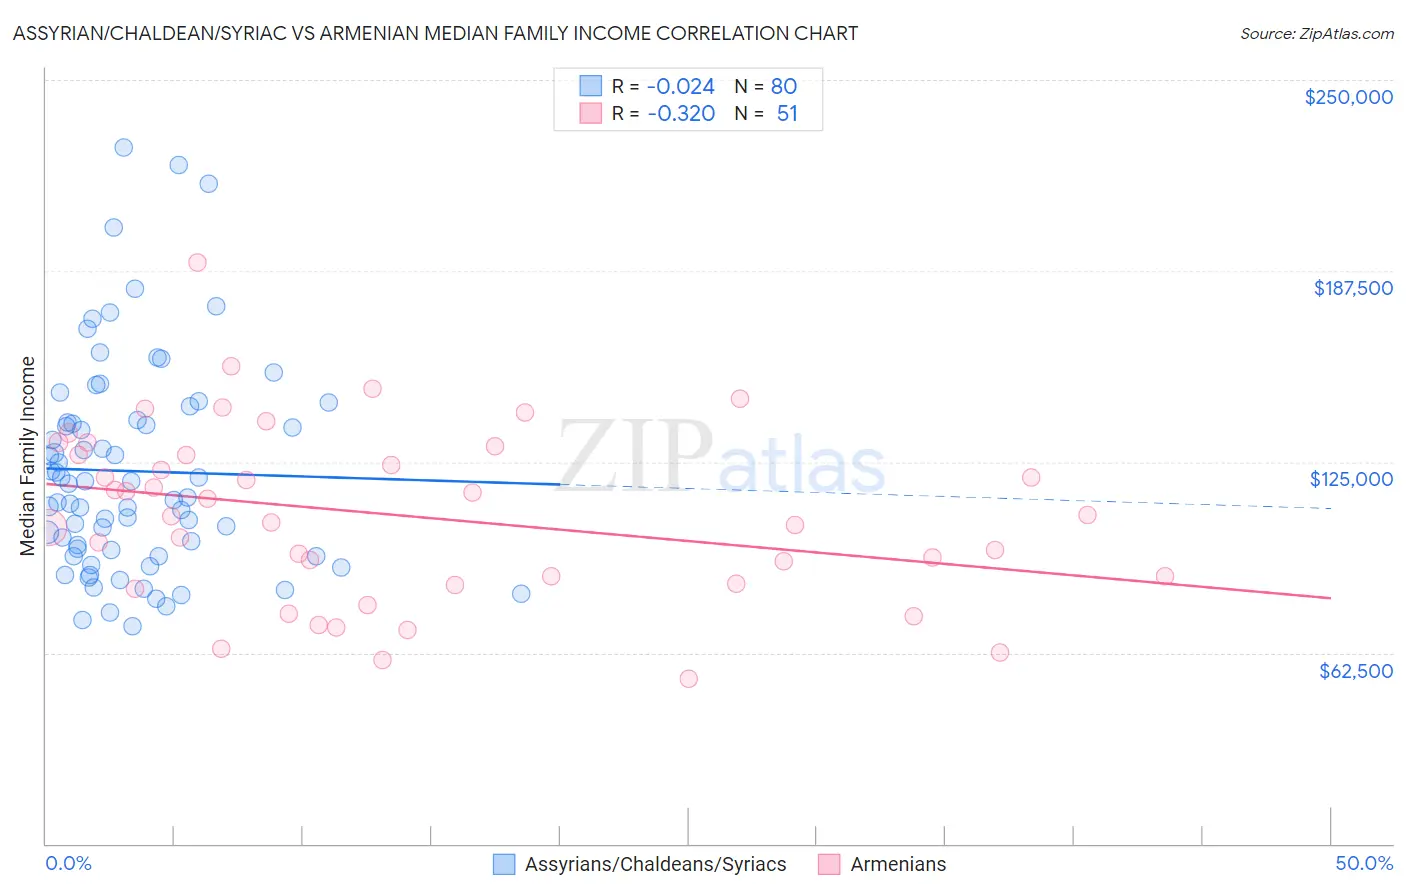
Assyrian/Chaldean/Syriac vs Armenian Median Family Income Correlation Chart
The statistical analysis conducted on geographies consisting of 110,249,217 people shows no correlation between the proportion of Assyrians/Chaldeans/Syriacs and median family income in the United States with a correlation coefficient (R) of -0.024 and weighted average of $109,622. Similarly, the statistical analysis conducted on geographies consisting of 310,689,637 people shows a mild negative correlation between the proportion of Armenians and median family income in the United States with a correlation coefficient (R) of -0.320 and weighted average of $109,692, a difference of 0.060%.
Median Family Income Correlation Summary
| Measurement | Assyrian/Chaldean/Syriac | Armenian |
| Minimum | $71,012 | $54,063 |
| Maximum | $228,043 | $190,202 |
| Range | $157,031 | $136,139 |
| Mean | $121,955 | $107,343 |
| Median | $115,499 | $107,236 |
| Interquartile 25% (IQ1) | $95,222 | $85,128 |
| Interquartile 75% (IQ3) | $138,288 | $127,200 |
| Interquartile Range (IQR) | $43,065 | $42,071 |
| Standard Deviation (Sample) | $34,820 | $28,557 |
| Standard Deviation (Population) | $34,602 | $28,276 |
Demographics Similar to Assyrians/Chaldeans/Syriacs and Armenians by Median Family Income
In terms of median family income, the demographic groups most similar to Assyrians/Chaldeans/Syriacs are Immigrants from Ukraine ($109,645, a difference of 0.020%), Macedonian ($109,668, a difference of 0.040%), Immigrants from Kuwait ($109,731, a difference of 0.10%), Immigrants from Brazil ($109,418, a difference of 0.19%), and Palestinian ($109,413, a difference of 0.19%). Similarly, the demographic groups most similar to Armenians are Macedonian ($109,668, a difference of 0.020%), Immigrants from Kuwait ($109,731, a difference of 0.040%), Immigrants from Ukraine ($109,645, a difference of 0.040%), Jordanian ($109,865, a difference of 0.16%), and Immigrants from Brazil ($109,418, a difference of 0.25%).
| Demographics | Rating | Rank | Median Family Income |
| Northern Europeans | 98.3 /100 | #90 | Exceptional $110,635 |
| Immigrants | Southern Europe | 98.3 /100 | #91 | Exceptional $110,614 |
| Immigrants | Lebanon | 97.9 /100 | #92 | Exceptional $110,159 |
| Immigrants | Kazakhstan | 97.8 /100 | #93 | Exceptional $110,137 |
| Koreans | 97.8 /100 | #94 | Exceptional $110,103 |
| Zimbabweans | 97.7 /100 | #95 | Exceptional $110,011 |
| Immigrants | Moldova | 97.7 /100 | #96 | Exceptional $109,975 |
| Jordanians | 97.5 /100 | #97 | Exceptional $109,865 |
| Immigrants | Kuwait | 97.4 /100 | #98 | Exceptional $109,731 |
| Armenians | 97.3 /100 | #99 | Exceptional $109,692 |
| Macedonians | 97.3 /100 | #100 | Exceptional $109,668 |
| Immigrants | Ukraine | 97.2 /100 | #101 | Exceptional $109,645 |
| Assyrians/Chaldeans/Syriacs | 97.2 /100 | #102 | Exceptional $109,622 |
| Immigrants | Brazil | 96.9 /100 | #103 | Exceptional $109,418 |
| Palestinians | 96.9 /100 | #104 | Exceptional $109,413 |
| Syrians | 96.7 /100 | #105 | Exceptional $109,299 |
| Albanians | 96.4 /100 | #106 | Exceptional $109,136 |
| Immigrants | North Macedonia | 96.4 /100 | #107 | Exceptional $109,136 |
| Immigrants | Zimbabwe | 95.9 /100 | #108 | Exceptional $108,830 |
| Immigrants | Afghanistan | 95.6 /100 | #109 | Exceptional $108,709 |
| British | 95.6 /100 | #110 | Exceptional $108,705 |