Assyrian/Chaldean/Syriac vs Marshallese Median Family Income

COMPARE

Assyrian/Chaldean/Syriac
Race
Ancestry
AfghanAfricanAlaska NativeAlaskan AthabascanAlbanianAleutAlsatianAmericanApacheArabArapahoArgentineanArmenianAssyrian/Chaldean/SyriacAustralianAustrianBahamianBangladeshiBarbadianBasqueBelgianBelizeanBermudanBhutaneseBlackfeetBolivianBrazilianBritishBritish West IndianBulgarianBurmeseCajunCambodianCanadianCape VerdeanCarpatho RusynCelticCentral AmericanCentral American IndianCherokeeCheyenneChickasawChileanChineseChippewaChoctawColombianColvilleComancheCosta RicanCreeCreekCroatianCrowCubanCypriotCzechCzechoslovakianDanishDelawareDominicanDutchDutch West IndianEastern EuropeanEcuadorianEgyptianEnglishEstonianEthiopianEuropeanFijianFilipinoFinnishFrenchFrench American IndianFrench CanadianGermanGerman RussianGhanaianGreekGuamanian/ChamorroGuatemalanGuyaneseHaitianHmongHonduranHopiHoumaHungarianIcelanderIndian (Asian)IndonesianInupiatIranianIraqiIrishIroquoisIsraeliItalianJamaicanJapaneseJordanianKenyanKiowaKoreanLaotianLatvianLebaneseLiberianLithuanianLumbeeLuxembourgerMacedonianMalaysianMalteseMenomineeMexicanMexican American IndianMongolianMoroccanNative HawaiianNavajoNepaleseNew ZealanderNicaraguanNigerianNorthern EuropeanNorwegianOkinawanOsageOttawaPaiutePakistaniPalestinianPanamanianParaguayanPennsylvania GermanPeruvianPimaPolishPortuguesePotawatomiPuebloPuerto RicanPuget Sound SalishRomanianRussianSalvadoranSamoanScandinavianScotch-IrishScottishSeminoleSenegaleseSerbianShoshoneSierra LeoneanSiouxSlavicSlovakSloveneSomaliSouth AfricanSouth AmericanSouth American IndianSoviet UnionSpaniardSpanishSpanish AmericanSpanish American IndianSri LankanSubsaharan AfricanSudaneseSwedishSwissSyrianTaiwaneseThaiTlingit-HaidaTohono O'OdhamTonganTrinidadian and TobagonianTsimshianTurkishU.S. Virgin IslanderUgandanUkrainianUruguayanUteVenezuelanVietnameseWelshWest IndianYakamaYaquiYugoslavianYumanYup'ikZimbabwean
Immigration
NonimmigrantsImmigrantsAfghanistanAfricaAlbaniaArgentinaArmeniaAsiaAustraliaAustriaBahamasBangladeshBarbadosBelarusBelgiumBelizeBoliviaBosnia and HerzegovinaBrazilBulgariaBurma/MyanmarCabo VerdeCambodiaCameroonCanadaCaribbeanCentral AmericaChileChinaColombiaCongoCosta RicaCroatiaCubaCzechoslovakiaDenmarkDominicaDominican RepublicEastern AfricaEastern AsiaEastern EuropeEcuadorEgyptEl SalvadorEnglandEritreaEthiopiaEuropeFijiFranceGermanyGhanaGreeceGrenadaGuatemalaGuyanaHaitiHondurasHong KongHungaryIndiaIndonesiaIranIraqIrelandIsraelItalyJamaicaJapanJordanKazakhstanKenyaKoreaKuwaitLaosLatin AmericaLatviaLebanonLiberiaLithuaniaMalaysiaMexicoMicronesiaMiddle AfricaMoldovaMoroccoNepalNetherlandsNicaraguaNigeriaNorth AmericaNorth MacedoniaNorthern AfricaNorthern EuropeNorwayOceaniaPakistanPanamaPeruPhilippinesPolandPortugalRomaniaRussiaSaudi ArabiaScotlandSenegalSerbiaSierra LeoneSingaporeSomaliaSouth AfricaSouth AmericaSouth Central AsiaSouth Eastern AsiaSouthern EuropeSpainSri LankaSt. Vincent and the GrenadinesSudanSwedenSwitzerlandSyriaTaiwanThailandTrinidad and TobagoTurkeyUgandaUkraineUruguayUzbekistanVenezuelaVietnamWest IndiesWestern AfricaWestern AsiaWestern EuropeYemenZaireZimbabweAzores
Marshallese
Race
Ancestry
AfghanAfricanAlaska NativeAlaskan AthabascanAlbanianAleutAlsatianAmericanApacheArabArapahoArgentineanArmenianAustralianAustrianBahamianBangladeshiBarbadianBasqueBelgianBelizeanBermudanBhutaneseBlackfeetBolivianBrazilianBritishBritish West IndianBulgarianBurmeseCajunCambodianCanadianCape VerdeanCarpatho RusynCelticCentral AmericanCentral American IndianCherokeeCheyenneChickasawChileanChineseChippewaChoctawColombianColvilleComancheCosta RicanCreeCreekCroatianCrowCubanCypriotCzechCzechoslovakianDanishDelawareDominicanDutchDutch West IndianEastern EuropeanEcuadorianEgyptianEnglishEstonianEthiopianEuropeanFijianFilipinoFinnishFrenchFrench American IndianFrench CanadianGermanGerman RussianGhanaianGreekGuamanian/ChamorroGuatemalanGuyaneseHaitianHmongHonduranHopiHoumaHungarianIcelanderIndian (Asian)IndonesianInupiatIranianIraqiIrishIroquoisIsraeliItalianJamaicanJapaneseJordanianKenyanKiowaKoreanLaotianLatvianLebaneseLiberianLithuanianLumbeeLuxembourgerMacedonianMalaysianMalteseMarshalleseMenomineeMexicanMexican American IndianMongolianMoroccanNative HawaiianNavajoNepaleseNew ZealanderNicaraguanNigerianNorthern EuropeanNorwegianOkinawanOsageOttawaPaiutePakistaniPalestinianPanamanianParaguayanPennsylvania GermanPeruvianPimaPolishPortuguesePotawatomiPuebloPuerto RicanPuget Sound SalishRomanianRussianSalvadoranSamoanScandinavianScotch-IrishScottishSeminoleSenegaleseSerbianShoshoneSierra LeoneanSiouxSlavicSlovakSloveneSomaliSouth AfricanSouth AmericanSouth American IndianSoviet UnionSpaniardSpanishSpanish AmericanSpanish American IndianSri LankanSubsaharan AfricanSudaneseSwedishSwissSyrianTaiwaneseThaiTlingit-HaidaTohono O'OdhamTonganTrinidadian and TobagonianTsimshianTurkishU.S. Virgin IslanderUgandanUkrainianUruguayanUteVenezuelanVietnameseWelshWest IndianYakamaYaquiYugoslavianYumanYup'ikZimbabwean
Immigration
NonimmigrantsImmigrantsAfghanistanAfricaAlbaniaArgentinaArmeniaAsiaAustraliaAustriaBahamasBangladeshBarbadosBelarusBelgiumBelizeBoliviaBosnia and HerzegovinaBrazilBulgariaBurma/MyanmarCabo VerdeCambodiaCameroonCanadaCaribbeanCentral AmericaChileChinaColombiaCongoCosta RicaCroatiaCubaCzechoslovakiaDenmarkDominicaDominican RepublicEastern AfricaEastern AsiaEastern EuropeEcuadorEgyptEl SalvadorEnglandEritreaEthiopiaEuropeFijiFranceGermanyGhanaGreeceGrenadaGuatemalaGuyanaHaitiHondurasHong KongHungaryIndiaIndonesiaIranIraqIrelandIsraelItalyJamaicaJapanJordanKazakhstanKenyaKoreaKuwaitLaosLatin AmericaLatviaLebanonLiberiaLithuaniaMalaysiaMexicoMicronesiaMiddle AfricaMoldovaMoroccoNepalNetherlandsNicaraguaNigeriaNorth AmericaNorth MacedoniaNorthern AfricaNorthern EuropeNorwayOceaniaPakistanPanamaPeruPhilippinesPolandPortugalRomaniaRussiaSaudi ArabiaScotlandSenegalSerbiaSierra LeoneSingaporeSomaliaSouth AfricaSouth AmericaSouth Central AsiaSouth Eastern AsiaSouthern EuropeSpainSri LankaSt. Vincent and the GrenadinesSudanSwedenSwitzerlandSyriaTaiwanThailandTrinidad and TobagoTurkeyUgandaUkraineUruguayUzbekistanVenezuelaVietnamWest IndiesWestern AfricaWestern AsiaWestern EuropeYemenZaireZimbabweAzores
Median Family Income
Income
Poverty
Unemployment
Labor Participation
Family Structure
Vehicle Availability
Education Level
Disability

Median Family Income Comparison

Assyrians/Chaldeans/Syriacs

Marshallese

Exceptional
Tragic
$109,622
MEDIAN FAMILY INCOME
97.2/ 100
METRIC RATING
102nd/ 347
METRIC RANK
$95,293
MEDIAN FAMILY INCOME
2.2/ 100
METRIC RATING
229th/ 347
METRIC RANK

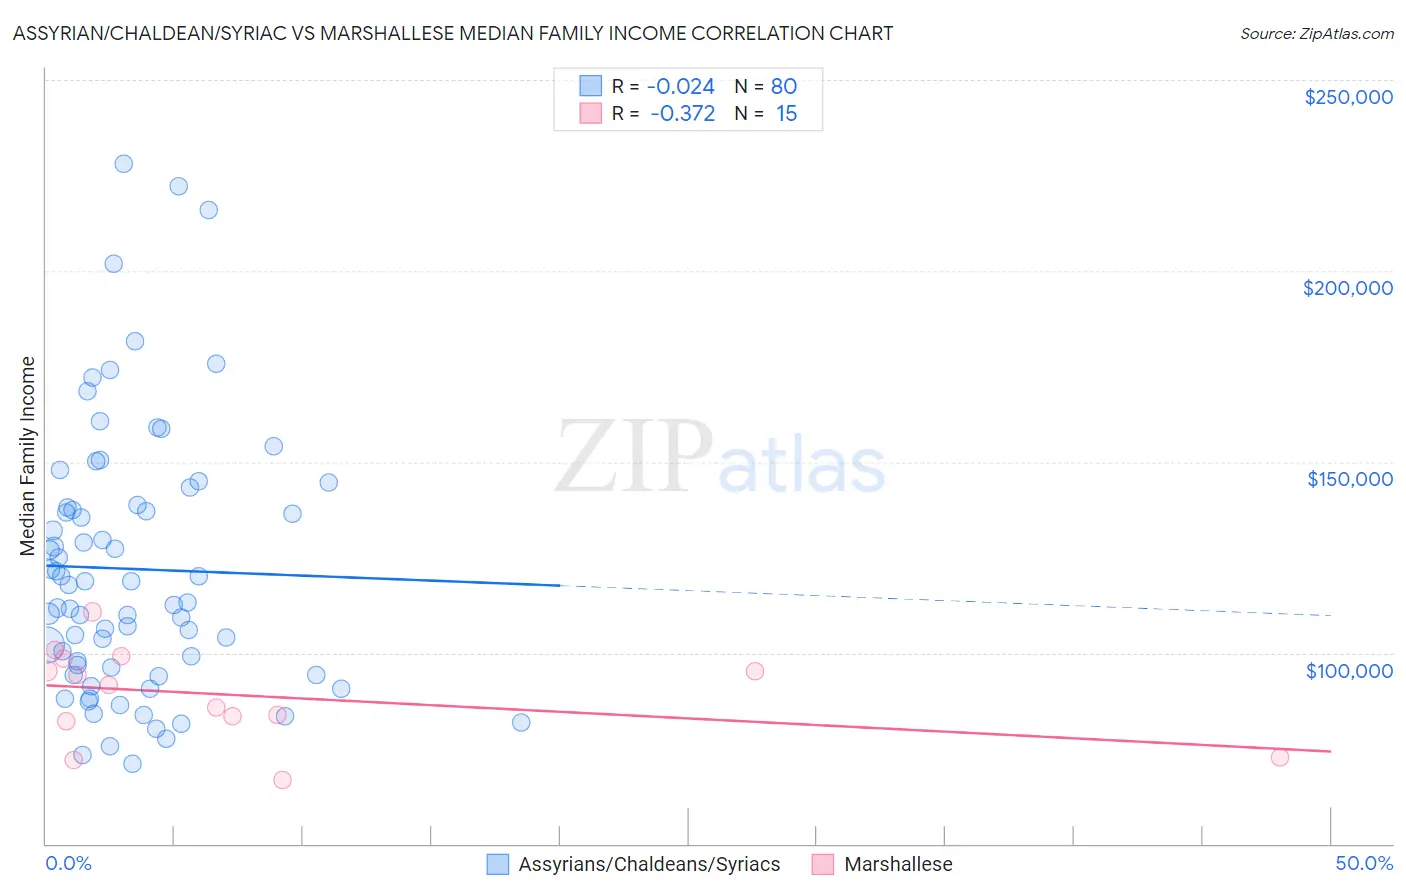
Assyrian/Chaldean/Syriac vs Marshallese Median Family Income Correlation Chart

The statistical analysis conducted on geographies consisting of 110,249,217 people shows no correlation between the proportion of Assyrians/Chaldeans/Syriacs and median family income in the United States with a correlation coefficient (R) of -0.024 and weighted average of $109,622. Similarly, the statistical analysis conducted on geographies consisting of 14,760,991 people shows a mild negative correlation between the proportion of Marshallese and median family income in the United States with a correlation coefficient (R) of -0.372 and weighted average of $95,293, a difference of 15.0%.
Assyrian/Chaldean/Syriac vs Marshallese Median Family Income

Median Family Income Correlation Summary

MeasurementAssyrian/Chaldean/SyriacMarshallese
Minimum$71,012$66,563
Maximum$228,043$110,724
Range$157,031$44,161
Mean$121,955$88,730
Median$115,499$91,530
Interquartile 25% (IQ1)$95,222$81,946
Interquartile 75% (IQ3)$138,288$98,411
Interquartile Range (IQR)$43,065$16,465
Standard Deviation (Sample)$34,820$12,233
Standard Deviation (Population)$34,602$11,818

Similar Demographics by Median Family Income

Demographics Similar to Assyrians/Chaldeans/Syriacs by Median Family Income

In terms of median family income, the demographic groups most similar to Assyrians/Chaldeans/Syriacs are Immigrants from Ukraine ($109,645, a difference of 0.020%), Macedonian ($109,668, a difference of 0.040%), Armenian ($109,692, a difference of 0.060%), Immigrants from Kuwait ($109,731, a difference of 0.10%), and Immigrants from Brazil ($109,418, a difference of 0.19%).
DemographicsRating | RankMedian Family Income
Zimbabweans
97.7
/100
|
#95
Exceptional
$110,011
Immigrants | Moldova
97.7
/100
|
#96
Exceptional
$109,975
Jordanians
97.5
/100
|
#97
Exceptional
$109,865
Immigrants | Kuwait
97.4
/100
|
#98
Exceptional
$109,731
Armenians
97.3
/100
|
#99
Exceptional
$109,692
Macedonians
97.3
/100
|
#100
Exceptional
$109,668
Immigrants | Ukraine
97.2
/100
|
#101
Exceptional
$109,645
Assyrians/Chaldeans/Syriacs
97.2
/100
|
#102
Exceptional
$109,622
Immigrants | Brazil
96.9
/100
|
#103
Exceptional
$109,418
Palestinians
96.9
/100
|
#104
Exceptional
$109,413
Syrians
96.7
/100
|
#105
Exceptional
$109,299
Albanians
96.4
/100
|
#106
Exceptional
$109,136
Immigrants | North Macedonia
96.4
/100
|
#107
Exceptional
$109,136
Immigrants | Zimbabwe
95.9
/100
|
#108
Exceptional
$108,830
Immigrants | Afghanistan
95.6
/100
|
#109
Exceptional
$108,709

Demographics Similar to Marshallese by Median Family Income

In terms of median family income, the demographic groups most similar to Marshallese are Malaysian ($95,230, a difference of 0.070%), Immigrants from the Azores ($95,402, a difference of 0.11%), Ecuadorian ($95,114, a difference of 0.19%), Alaska Native ($95,573, a difference of 0.29%), and Immigrants from Panama ($95,647, a difference of 0.37%).
DemographicsRating | RankMedian Family Income
Immigrants | Nigeria
4.0
/100
|
#222
Tragic
$96,439
Venezuelans
3.7
/100
|
#223
Tragic
$96,281
Immigrants | Nonimmigrants
3.6
/100
|
#224
Tragic
$96,231
Vietnamese
3.4
/100
|
#225
Tragic
$96,123
Immigrants | Panama
2.7
/100
|
#226
Tragic
$95,647
Alaska Natives
2.6
/100
|
#227
Tragic
$95,573
Immigrants | Azores
2.4
/100
|
#228
Tragic
$95,402
Marshallese
2.2
/100
|
#229
Tragic
$95,293
Malaysians
2.2
/100
|
#230
Tragic
$95,230
Ecuadorians
2.1
/100
|
#231
Tragic
$95,114
Immigrants | Venezuela
1.9
/100
|
#232
Tragic
$94,904
Immigrants | Bangladesh
1.6
/100
|
#233
Tragic
$94,665
Immigrants | Western Africa
1.6
/100
|
#234
Tragic
$94,638
Immigrants | Burma/Myanmar
1.5
/100
|
#235
Tragic
$94,472
Trinidadians and Tobagonians
1.5
/100
|
#236
Tragic
$94,466