Assyrian/Chaldean/Syriac vs Immigrants from Colombia Median Family Income
COMPARE
Assyrian/Chaldean/Syriac
Immigrants from Colombia
Median Family Income
Median Family Income Comparison
Assyrians/Chaldeans/Syriacs
Immigrants from Colombia
$109,622
MEDIAN FAMILY INCOME
97.2/ 100
METRIC RATING
102nd/ 347
METRIC RANK
$98,067
MEDIAN FAMILY INCOME
8.7/ 100
METRIC RATING
209th/ 347
METRIC RANK
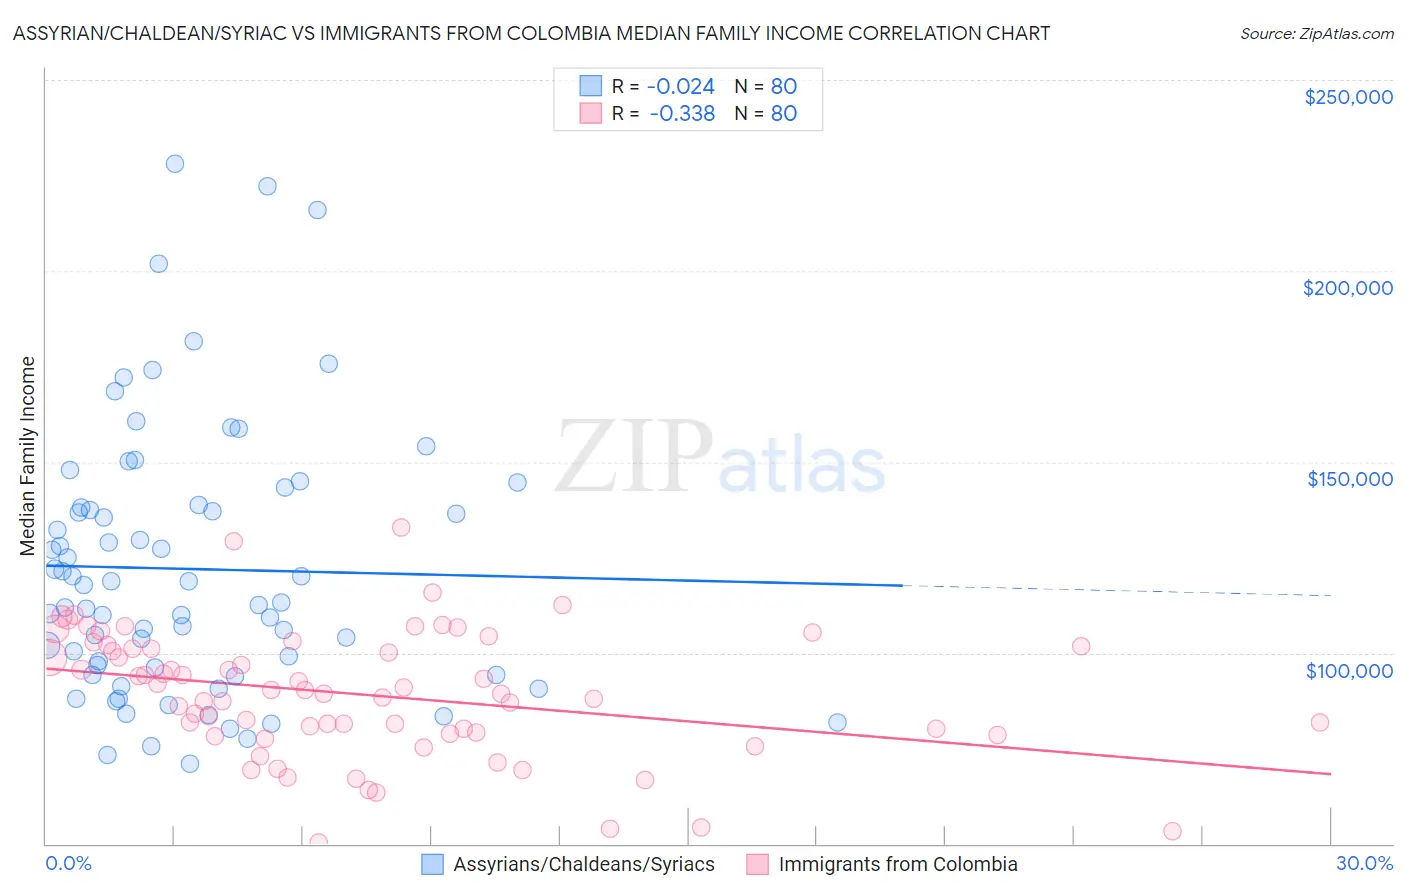
Assyrian/Chaldean/Syriac vs Immigrants from Colombia Median Family Income Correlation Chart
The statistical analysis conducted on geographies consisting of 110,249,217 people shows no correlation between the proportion of Assyrians/Chaldeans/Syriacs and median family income in the United States with a correlation coefficient (R) of -0.024 and weighted average of $109,622. Similarly, the statistical analysis conducted on geographies consisting of 378,430,700 people shows a mild negative correlation between the proportion of Immigrants from Colombia and median family income in the United States with a correlation coefficient (R) of -0.338 and weighted average of $98,067, a difference of 11.8%.
Median Family Income Correlation Summary
| Measurement | Assyrian/Chaldean/Syriac | Immigrants from Colombia |
| Minimum | $71,012 | $50,234 |
| Maximum | $228,043 | $132,768 |
| Range | $157,031 | $82,534 |
| Mean | $121,955 | $89,152 |
| Median | $115,499 | $89,834 |
| Interquartile 25% (IQ1) | $95,222 | $78,980 |
| Interquartile 75% (IQ3) | $138,288 | $101,483 |
| Interquartile Range (IQR) | $43,065 | $22,502 |
| Standard Deviation (Sample) | $34,820 | $16,604 |
| Standard Deviation (Population) | $34,602 | $16,499 |
Similar Demographics by Median Family Income
Demographics Similar to Assyrians/Chaldeans/Syriacs by Median Family Income
In terms of median family income, the demographic groups most similar to Assyrians/Chaldeans/Syriacs are Immigrants from Ukraine ($109,645, a difference of 0.020%), Macedonian ($109,668, a difference of 0.040%), Armenian ($109,692, a difference of 0.060%), Immigrants from Kuwait ($109,731, a difference of 0.10%), and Immigrants from Brazil ($109,418, a difference of 0.19%).
| Demographics | Rating | Rank | Median Family Income |
| Zimbabweans | 97.7 /100 | #95 | Exceptional $110,011 |
| Immigrants | Moldova | 97.7 /100 | #96 | Exceptional $109,975 |
| Jordanians | 97.5 /100 | #97 | Exceptional $109,865 |
| Immigrants | Kuwait | 97.4 /100 | #98 | Exceptional $109,731 |
| Armenians | 97.3 /100 | #99 | Exceptional $109,692 |
| Macedonians | 97.3 /100 | #100 | Exceptional $109,668 |
| Immigrants | Ukraine | 97.2 /100 | #101 | Exceptional $109,645 |
| Assyrians/Chaldeans/Syriacs | 97.2 /100 | #102 | Exceptional $109,622 |
| Immigrants | Brazil | 96.9 /100 | #103 | Exceptional $109,418 |
| Palestinians | 96.9 /100 | #104 | Exceptional $109,413 |
| Syrians | 96.7 /100 | #105 | Exceptional $109,299 |
| Albanians | 96.4 /100 | #106 | Exceptional $109,136 |
| Immigrants | North Macedonia | 96.4 /100 | #107 | Exceptional $109,136 |
| Immigrants | Zimbabwe | 95.9 /100 | #108 | Exceptional $108,830 |
| Immigrants | Afghanistan | 95.6 /100 | #109 | Exceptional $108,709 |
Demographics Similar to Immigrants from Colombia by Median Family Income
In terms of median family income, the demographic groups most similar to Immigrants from Colombia are Puget Sound Salish ($97,958, a difference of 0.11%), Immigrants from Uruguay ($98,205, a difference of 0.14%), Immigrants from Sudan ($97,737, a difference of 0.34%), Panamanian ($97,683, a difference of 0.39%), and Immigrants from Armenia ($97,605, a difference of 0.47%).
| Demographics | Rating | Rank | Median Family Income |
| Whites/Caucasians | 18.7 /100 | #202 | Poor $99,800 |
| Scotch-Irish | 17.1 /100 | #203 | Poor $99,591 |
| Ghanaians | 12.6 /100 | #204 | Poor $98,877 |
| Hawaiians | 12.5 /100 | #205 | Poor $98,869 |
| Immigrants | Iraq | 12.1 /100 | #206 | Poor $98,786 |
| Aleuts | 11.6 /100 | #207 | Poor $98,702 |
| Immigrants | Uruguay | 9.2 /100 | #208 | Tragic $98,205 |
| Immigrants | Colombia | 8.7 /100 | #209 | Tragic $98,067 |
| Puget Sound Salish | 8.2 /100 | #210 | Tragic $97,958 |
| Immigrants | Sudan | 7.4 /100 | #211 | Tragic $97,737 |
| Panamanians | 7.2 /100 | #212 | Tragic $97,683 |
| Immigrants | Armenia | 7.0 /100 | #213 | Tragic $97,605 |
| Bermudans | 6.9 /100 | #214 | Tragic $97,577 |
| Nigerians | 6.7 /100 | #215 | Tragic $97,522 |
| Immigrants | Bosnia and Herzegovina | 6.4 /100 | #216 | Tragic $97,432 |