Lumbee vs Bahamian Wage/Income Gap
COMPARE
Lumbee
Bahamian
Wage/Income Gap
Wage/Income Gap Comparison
Lumbee
Bahamians
21.3%
WAGE/INCOME GAP
100.0/ 100
METRIC RATING
40th/ 347
METRIC RANK
20.2%
WAGE/INCOME GAP
100.0/ 100
METRIC RATING
20th/ 347
METRIC RANK
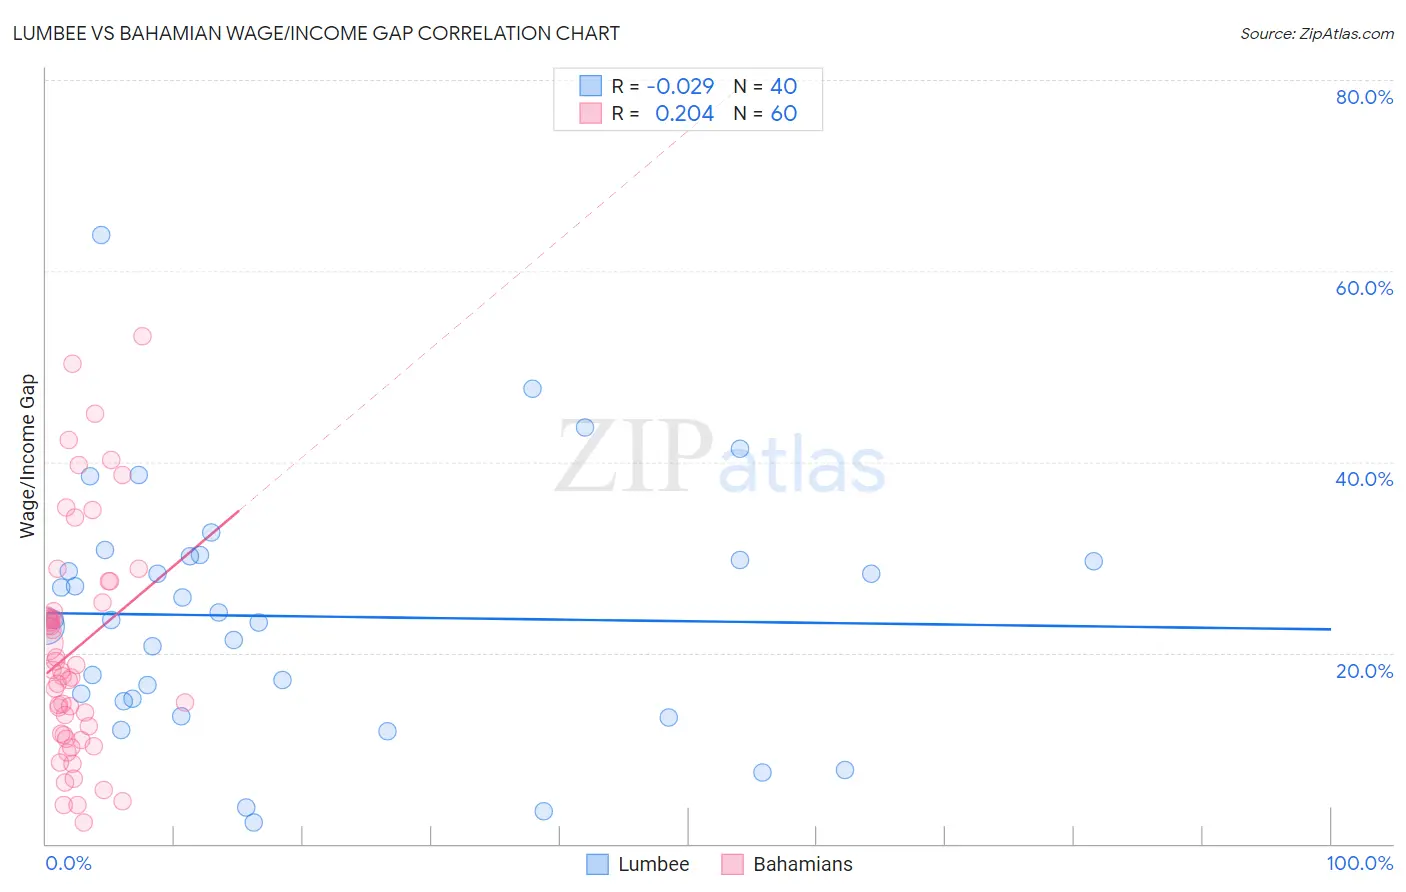
Lumbee vs Bahamian Wage/Income Gap Correlation Chart
The statistical analysis conducted on geographies consisting of 92,243,625 people shows no correlation between the proportion of Lumbee and wage/income gap percentage in the United States with a correlation coefficient (R) of -0.029 and weighted average of 21.3%. Similarly, the statistical analysis conducted on geographies consisting of 112,648,688 people shows a weak positive correlation between the proportion of Bahamians and wage/income gap percentage in the United States with a correlation coefficient (R) of 0.204 and weighted average of 20.2%, a difference of 5.3%.
Wage/Income Gap Correlation Summary
| Measurement | Lumbee | Bahamian |
| Minimum | 2.2% | 2.2% |
| Maximum | 63.8% | 53.2% |
| Range | 61.6% | 50.9% |
| Mean | 23.8% | 20.4% |
| Median | 23.4% | 18.1% |
| Interquartile 25% (IQ1) | 15.1% | 11.4% |
| Interquartile 75% (IQ3) | 29.9% | 24.8% |
| Interquartile Range (IQR) | 14.8% | 13.4% |
| Standard Deviation (Sample) | 12.8% | 11.8% |
| Standard Deviation (Population) | 12.6% | 11.7% |
Demographics Similar to Lumbee and Bahamians by Wage/Income Gap
In terms of wage/income gap, the demographic groups most similar to Lumbee are Colville (21.3%, a difference of 0.20%), Immigrants from Belize (21.3%, a difference of 0.31%), Immigrants from Somalia (21.2%, a difference of 0.36%), Belizean (21.2%, a difference of 0.43%), and Somali (21.2%, a difference of 0.45%). Similarly, the demographic groups most similar to Bahamians are Immigrants from Caribbean (20.4%, a difference of 0.72%), Immigrants from Liberia (20.6%, a difference of 1.5%), Immigrants from Dominican Republic (20.6%, a difference of 1.5%), Dominican (20.6%, a difference of 1.7%), and Senegalese (20.7%, a difference of 2.0%).
| Demographics | Rating | Rank | Wage/Income Gap |
| Bahamians | 100.0 /100 | #20 | Exceptional 20.2% |
| Immigrants | Caribbean | 100.0 /100 | #21 | Exceptional 20.4% |
| Immigrants | Liberia | 100.0 /100 | #22 | Exceptional 20.6% |
| Immigrants | Dominican Republic | 100.0 /100 | #23 | Exceptional 20.6% |
| Dominicans | 100.0 /100 | #24 | Exceptional 20.6% |
| Senegalese | 100.0 /100 | #25 | Exceptional 20.7% |
| Pueblo | 100.0 /100 | #26 | Exceptional 20.7% |
| Immigrants | Armenia | 100.0 /100 | #27 | Exceptional 20.7% |
| Inupiat | 100.0 /100 | #28 | Exceptional 20.8% |
| Immigrants | Senegal | 100.0 /100 | #29 | Exceptional 20.9% |
| Immigrants | Bangladesh | 100.0 /100 | #30 | Exceptional 20.9% |
| Vietnamese | 100.0 /100 | #31 | Exceptional 21.0% |
| Immigrants | Yemen | 100.0 /100 | #32 | Exceptional 21.1% |
| Immigrants | Bahamas | 100.0 /100 | #33 | Exceptional 21.1% |
| Pima | 100.0 /100 | #34 | Exceptional 21.1% |
| Somalis | 100.0 /100 | #35 | Exceptional 21.2% |
| Belizeans | 100.0 /100 | #36 | Exceptional 21.2% |
| Immigrants | Somalia | 100.0 /100 | #37 | Exceptional 21.2% |
| Immigrants | Belize | 100.0 /100 | #38 | Exceptional 21.3% |
| Colville | 100.0 /100 | #39 | Exceptional 21.3% |
| Lumbee | 100.0 /100 | #40 | Exceptional 21.3% |