Uruguayan vs Bahamian College, 1 year or more
COMPARE
Uruguayan
Bahamian
College, 1 year or more
College, 1 year or more Comparison
Uruguayans
Bahamians
58.8%
COLLEGE, 1 YEAR OR MORE
31.8/ 100
METRIC RATING
189th/ 347
METRIC RANK
54.5%
COLLEGE, 1 YEAR OR MORE
0.2/ 100
METRIC RATING
271st/ 347
METRIC RANK
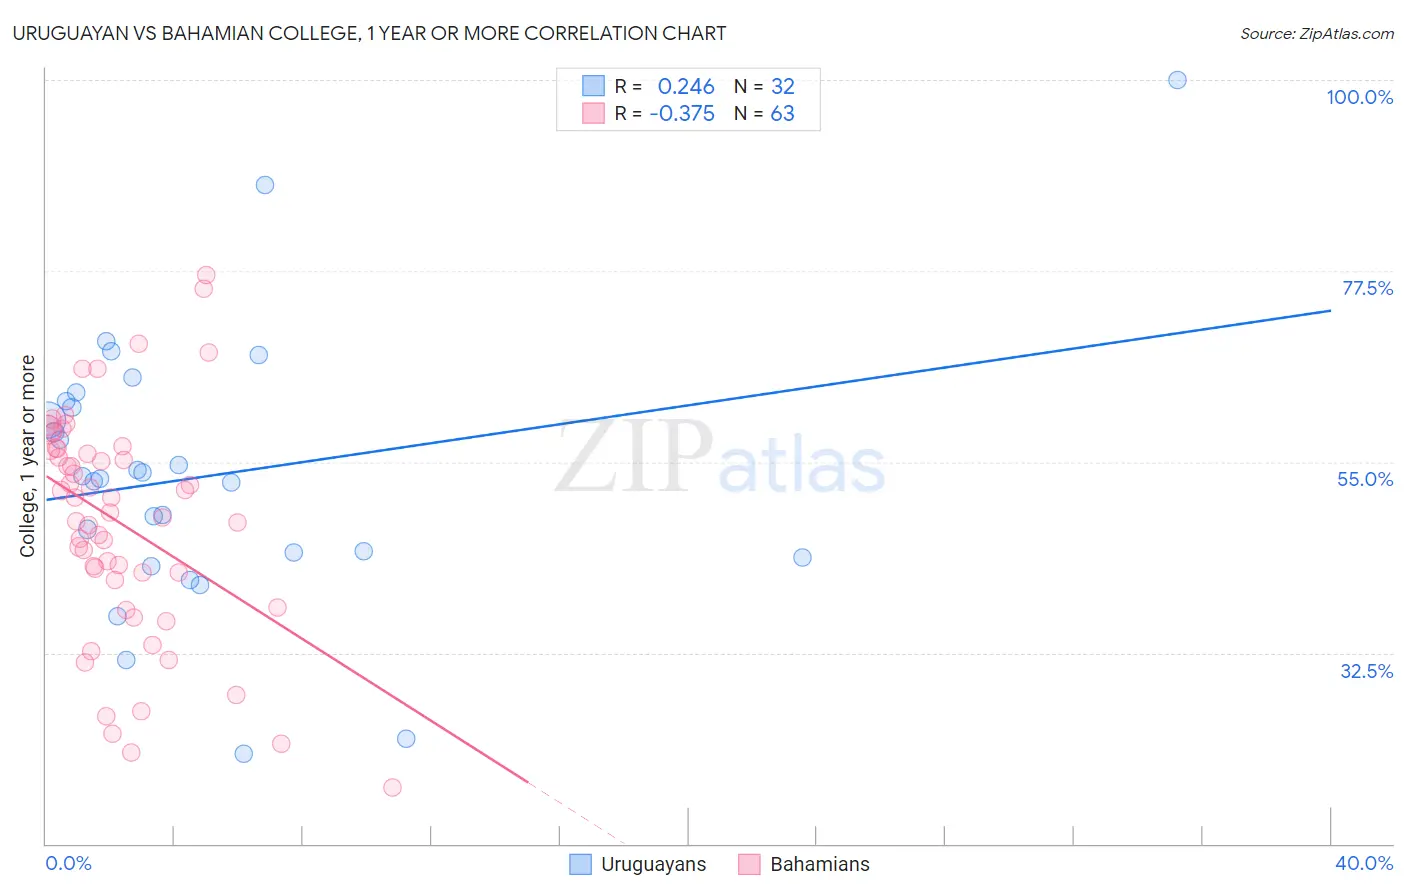
Uruguayan vs Bahamian College, 1 year or more Correlation Chart
The statistical analysis conducted on geographies consisting of 144,782,794 people shows a weak positive correlation between the proportion of Uruguayans and percentage of population with at least college, 1 year or more education in the United States with a correlation coefficient (R) of 0.246 and weighted average of 58.8%. Similarly, the statistical analysis conducted on geographies consisting of 112,705,508 people shows a mild negative correlation between the proportion of Bahamians and percentage of population with at least college, 1 year or more education in the United States with a correlation coefficient (R) of -0.375 and weighted average of 54.5%, a difference of 8.0%.
College, 1 year or more Correlation Summary
| Measurement | Uruguayan | Bahamian |
| Minimum | 20.6% | 16.6% |
| Maximum | 100.0% | 77.1% |
| Range | 79.4% | 60.4% |
| Mean | 53.3% | 47.8% |
| Median | 53.2% | 49.1% |
| Interquartile 25% (IQ1) | 44.0% | 41.0% |
| Interquartile 75% (IQ3) | 61.8% | 56.5% |
| Interquartile Range (IQR) | 17.8% | 15.5% |
| Standard Deviation (Sample) | 16.1% | 13.3% |
| Standard Deviation (Population) | 15.8% | 13.2% |
Similar Demographics by College, 1 year or more
Demographics Similar to Uruguayans by College, 1 year or more
In terms of college, 1 year or more, the demographic groups most similar to Uruguayans are Immigrants from Cameroon (58.8%, a difference of 0.040%), French (58.9%, a difference of 0.15%), German (58.9%, a difference of 0.17%), Immigrants from Philippines (58.7%, a difference of 0.17%), and Scotch-Irish (58.9%, a difference of 0.18%).
| Demographics | Rating | Rank | College, 1 year or more |
| Immigrants | Bosnia and Herzegovina | 42.8 /100 | #182 | Average 59.2% |
| German Russians | 39.3 /100 | #183 | Fair 59.1% |
| Spaniards | 38.3 /100 | #184 | Fair 59.0% |
| South Americans | 35.9 /100 | #185 | Fair 59.0% |
| Scotch-Irish | 34.7 /100 | #186 | Fair 58.9% |
| Germans | 34.7 /100 | #187 | Fair 58.9% |
| French | 34.4 /100 | #188 | Fair 58.9% |
| Uruguayans | 31.8 /100 | #189 | Fair 58.8% |
| Immigrants | Cameroon | 31.2 /100 | #190 | Fair 58.8% |
| Immigrants | Philippines | 29.2 /100 | #191 | Fair 58.7% |
| Colombians | 27.6 /100 | #192 | Fair 58.7% |
| Peruvians | 27.5 /100 | #193 | Fair 58.6% |
| Costa Ricans | 26.4 /100 | #194 | Fair 58.6% |
| Dutch | 26.2 /100 | #195 | Fair 58.6% |
| Guamanians/Chamorros | 26.2 /100 | #196 | Fair 58.6% |
Demographics Similar to Bahamians by College, 1 year or more
In terms of college, 1 year or more, the demographic groups most similar to Bahamians are Crow (54.5%, a difference of 0.020%), Comanche (54.4%, a difference of 0.050%), Bangladeshi (54.5%, a difference of 0.060%), Immigrants from Grenada (54.4%, a difference of 0.080%), and British West Indian (54.5%, a difference of 0.090%).
| Demographics | Rating | Rank | College, 1 year or more |
| Immigrants | Micronesia | 0.3 /100 | #264 | Tragic 54.8% |
| Immigrants | Laos | 0.2 /100 | #265 | Tragic 54.7% |
| Potawatomi | 0.2 /100 | #266 | Tragic 54.6% |
| Blackfeet | 0.2 /100 | #267 | Tragic 54.6% |
| British West Indians | 0.2 /100 | #268 | Tragic 54.5% |
| Bangladeshis | 0.2 /100 | #269 | Tragic 54.5% |
| Crow | 0.2 /100 | #270 | Tragic 54.5% |
| Bahamians | 0.2 /100 | #271 | Tragic 54.5% |
| Comanche | 0.2 /100 | #272 | Tragic 54.4% |
| Immigrants | Grenada | 0.2 /100 | #273 | Tragic 54.4% |
| Belizeans | 0.2 /100 | #274 | Tragic 54.4% |
| Americans | 0.2 /100 | #275 | Tragic 54.4% |
| Shoshone | 0.2 /100 | #276 | Tragic 54.3% |
| Ecuadorians | 0.2 /100 | #277 | Tragic 54.3% |
| Immigrants | Jamaica | 0.1 /100 | #278 | Tragic 54.2% |