Trinidadian and Tobagonian vs Mongolian Family Households with Children
COMPARE
Trinidadian and Tobagonian
Mongolian
Family Households with Children
Family Households with Children Comparison
Trinidadians and Tobagonians
Mongolians
26.4%
FAMILY HOUSEHOLDS WITH CHILDREN
0.1/ 100
METRIC RATING
299th/ 347
METRIC RANK
27.6%
FAMILY HOUSEHOLDS WITH CHILDREN
70.7/ 100
METRIC RATING
159th/ 347
METRIC RANK
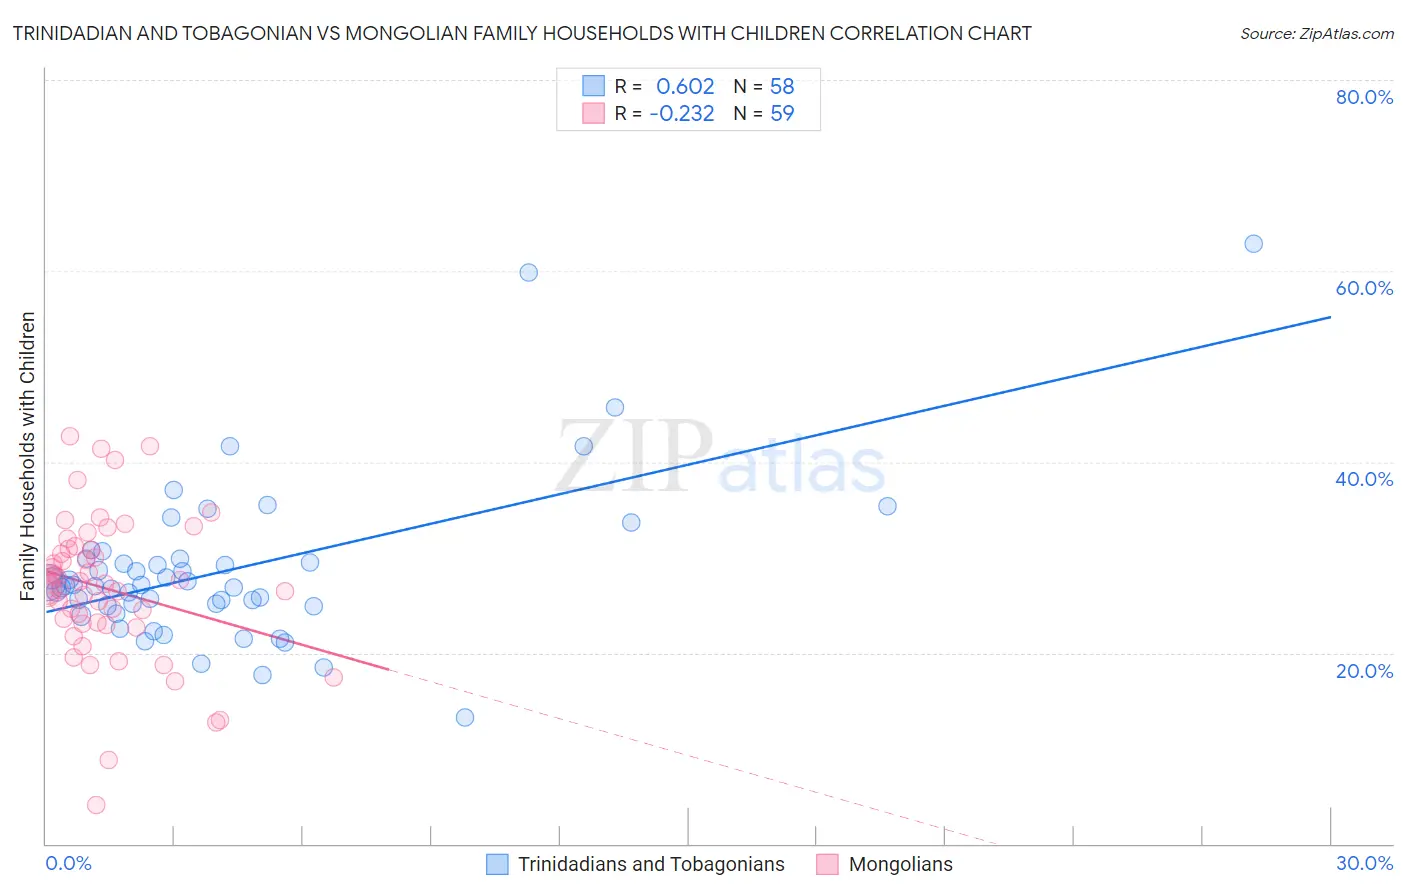
Trinidadian and Tobagonian vs Mongolian Family Households with Children Correlation Chart
The statistical analysis conducted on geographies consisting of 219,664,488 people shows a significant positive correlation between the proportion of Trinidadians and Tobagonians and percentage of family households with children in the United States with a correlation coefficient (R) of 0.602 and weighted average of 26.4%. Similarly, the statistical analysis conducted on geographies consisting of 140,279,389 people shows a weak negative correlation between the proportion of Mongolians and percentage of family households with children in the United States with a correlation coefficient (R) of -0.232 and weighted average of 27.6%, a difference of 4.5%.
Family Households with Children Correlation Summary
| Measurement | Trinidadian and Tobagonian | Mongolian |
| Minimum | 13.3% | 4.0% |
| Maximum | 62.8% | 42.6% |
| Range | 49.5% | 38.6% |
| Mean | 28.7% | 26.7% |
| Median | 27.1% | 27.2% |
| Interquartile 25% (IQ1) | 24.9% | 23.0% |
| Interquartile 75% (IQ3) | 29.8% | 30.8% |
| Interquartile Range (IQR) | 4.9% | 7.8% |
| Standard Deviation (Sample) | 8.5% | 7.5% |
| Standard Deviation (Population) | 8.4% | 7.5% |
Similar Demographics by Family Households with Children
Demographics Similar to Trinidadians and Tobagonians by Family Households with Children
In terms of family households with children, the demographic groups most similar to Trinidadians and Tobagonians are Immigrants from Western Europe (26.4%, a difference of 0.010%), Armenian (26.4%, a difference of 0.11%), Croatian (26.4%, a difference of 0.12%), Paiute (26.4%, a difference of 0.12%), and Macedonian (26.4%, a difference of 0.14%).
| Demographics | Rating | Rank | Family Households with Children |
| Poles | 0.2 /100 | #292 | Tragic 26.5% |
| Blacks/African Americans | 0.1 /100 | #293 | Tragic 26.5% |
| Latvians | 0.1 /100 | #294 | Tragic 26.4% |
| Macedonians | 0.1 /100 | #295 | Tragic 26.4% |
| Croatians | 0.1 /100 | #296 | Tragic 26.4% |
| Armenians | 0.1 /100 | #297 | Tragic 26.4% |
| Immigrants | Western Europe | 0.1 /100 | #298 | Tragic 26.4% |
| Trinidadians and Tobagonians | 0.1 /100 | #299 | Tragic 26.4% |
| Paiute | 0.1 /100 | #300 | Tragic 26.4% |
| Immigrants | Trinidad and Tobago | 0.1 /100 | #301 | Tragic 26.4% |
| Serbians | 0.1 /100 | #302 | Tragic 26.4% |
| Immigrants | Guyana | 0.1 /100 | #303 | Tragic 26.3% |
| Immigrants | Bahamas | 0.1 /100 | #304 | Tragic 26.3% |
| Guyanese | 0.1 /100 | #305 | Tragic 26.3% |
| Bermudans | 0.1 /100 | #306 | Tragic 26.3% |
Demographics Similar to Mongolians by Family Households with Children
In terms of family households with children, the demographic groups most similar to Mongolians are Romanian (27.6%, a difference of 0.0%), Indian (Asian) (27.6%, a difference of 0.020%), Subsaharan African (27.6%, a difference of 0.080%), Alaskan Athabascan (27.6%, a difference of 0.090%), and Immigrants from Bangladesh (27.6%, a difference of 0.10%).
| Demographics | Rating | Rank | Family Households with Children |
| Ethiopians | 77.0 /100 | #152 | Good 27.6% |
| Immigrants | Cabo Verde | 75.6 /100 | #153 | Good 27.6% |
| Icelanders | 75.3 /100 | #154 | Good 27.6% |
| Comanche | 74.8 /100 | #155 | Good 27.6% |
| Hungarians | 74.6 /100 | #156 | Good 27.6% |
| Indians (Asian) | 71.6 /100 | #157 | Good 27.6% |
| Romanians | 70.8 /100 | #158 | Good 27.6% |
| Mongolians | 70.7 /100 | #159 | Good 27.6% |
| Sub-Saharan Africans | 67.5 /100 | #160 | Good 27.6% |
| Alaskan Athabascans | 67.1 /100 | #161 | Good 27.6% |
| Immigrants | Bangladesh | 67.0 /100 | #162 | Good 27.6% |
| Czechs | 65.3 /100 | #163 | Good 27.5% |
| Immigrants | Hong Kong | 64.9 /100 | #164 | Good 27.5% |
| Immigrants | South Africa | 61.3 /100 | #165 | Good 27.5% |
| Immigrants | Nonimmigrants | 61.2 /100 | #166 | Good 27.5% |