Immigrants from Germany vs Mongolian Wage/Income Gap
COMPARE
Immigrants from Germany
Mongolian
Wage/Income Gap
Wage/Income Gap Comparison
Immigrants from Germany
Mongolians
27.5%
WAGE/INCOME GAP
1.5/ 100
METRIC RATING
261st/ 347
METRIC RANK
26.6%
WAGE/INCOME GAP
11.4/ 100
METRIC RATING
211th/ 347
METRIC RANK
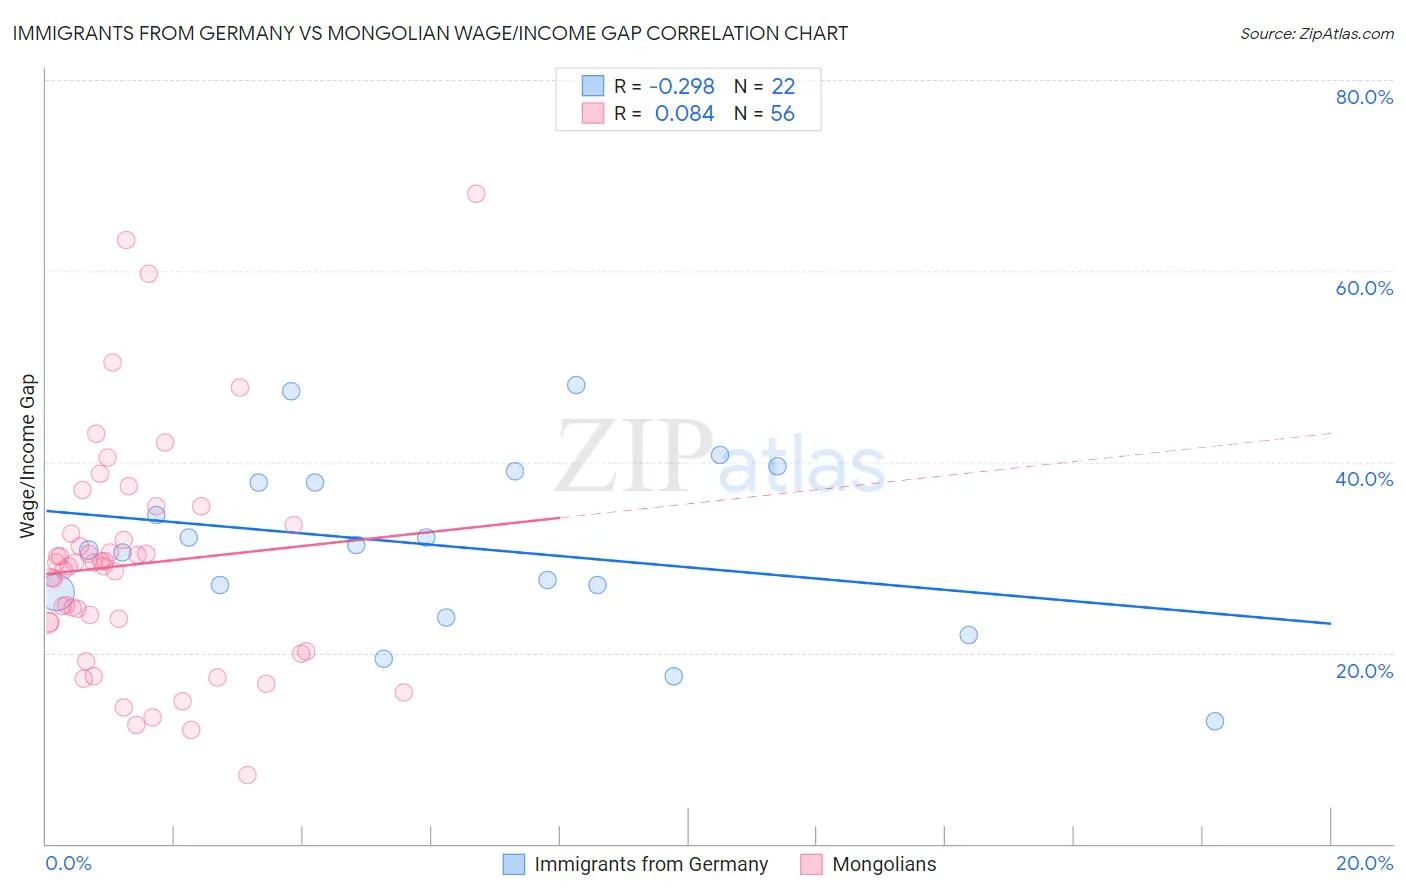
Immigrants from Germany vs Mongolian Wage/Income Gap Correlation Chart
The statistical analysis conducted on geographies consisting of 463,246,314 people shows a weak negative correlation between the proportion of Immigrants from Germany and wage/income gap percentage in the United States with a correlation coefficient (R) of -0.298 and weighted average of 27.5%. Similarly, the statistical analysis conducted on geographies consisting of 140,332,926 people shows a slight positive correlation between the proportion of Mongolians and wage/income gap percentage in the United States with a correlation coefficient (R) of 0.084 and weighted average of 26.6%, a difference of 3.4%.
Wage/Income Gap Correlation Summary
| Measurement | Immigrants from Germany | Mongolian |
| Minimum | 12.9% | 7.3% |
| Maximum | 48.0% | 68.0% |
| Range | 35.1% | 60.8% |
| Mean | 31.1% | 29.3% |
| Median | 31.0% | 29.2% |
| Interquartile 25% (IQ1) | 26.3% | 21.7% |
| Interquartile 75% (IQ3) | 37.9% | 32.9% |
| Interquartile Range (IQR) | 11.6% | 11.2% |
| Standard Deviation (Sample) | 9.1% | 12.2% |
| Standard Deviation (Population) | 8.9% | 12.1% |
Similar Demographics by Wage/Income Gap
Demographics Similar to Immigrants from Germany by Wage/Income Gap
In terms of wage/income gap, the demographic groups most similar to Immigrants from Germany are Immigrants from Lebanon (27.5%, a difference of 0.010%), Syrian (27.6%, a difference of 0.10%), Tongan (27.5%, a difference of 0.26%), Icelander (27.5%, a difference of 0.28%), and Slavic (27.4%, a difference of 0.36%).
| Demographics | Rating | Rank | Wage/Income Gap |
| Israelis | 2.1 /100 | #254 | Tragic 27.4% |
| Immigrants | France | 2.1 /100 | #255 | Tragic 27.4% |
| Cherokee | 1.9 /100 | #256 | Tragic 27.4% |
| Luxembourgers | 1.9 /100 | #257 | Tragic 27.4% |
| Slavs | 1.8 /100 | #258 | Tragic 27.4% |
| Icelanders | 1.8 /100 | #259 | Tragic 27.5% |
| Tongans | 1.7 /100 | #260 | Tragic 27.5% |
| Immigrants | Germany | 1.5 /100 | #261 | Tragic 27.5% |
| Immigrants | Lebanon | 1.5 /100 | #262 | Tragic 27.5% |
| Syrians | 1.4 /100 | #263 | Tragic 27.6% |
| Immigrants | Switzerland | 1.0 /100 | #264 | Tragic 27.7% |
| Serbians | 1.0 /100 | #265 | Tragic 27.7% |
| Hmong | 1.0 /100 | #266 | Tragic 27.7% |
| Turks | 1.0 /100 | #267 | Tragic 27.7% |
| New Zealanders | 1.0 /100 | #268 | Tragic 27.7% |
Demographics Similar to Mongolians by Wage/Income Gap
In terms of wage/income gap, the demographic groups most similar to Mongolians are Iraqi (26.6%, a difference of 0.030%), Arab (26.6%, a difference of 0.13%), Immigrants from Kuwait (26.6%, a difference of 0.17%), Immigrants from Iraq (26.7%, a difference of 0.18%), and Egyptian (26.6%, a difference of 0.19%).
| Demographics | Rating | Rank | Wage/Income Gap |
| Immigrants | Russia | 19.0 /100 | #204 | Poor 26.4% |
| Immigrants | Southern Europe | 17.3 /100 | #205 | Poor 26.4% |
| Indians (Asian) | 16.5 /100 | #206 | Poor 26.4% |
| Immigrants | Italy | 15.8 /100 | #207 | Poor 26.5% |
| Egyptians | 12.7 /100 | #208 | Poor 26.6% |
| Immigrants | Kuwait | 12.6 /100 | #209 | Poor 26.6% |
| Arabs | 12.3 /100 | #210 | Poor 26.6% |
| Mongolians | 11.4 /100 | #211 | Poor 26.6% |
| Iraqis | 11.2 /100 | #212 | Poor 26.6% |
| Immigrants | Iraq | 10.3 /100 | #213 | Poor 26.7% |
| Immigrants | China | 10.3 /100 | #214 | Poor 26.7% |
| Yugoslavians | 9.7 /100 | #215 | Tragic 26.7% |
| Immigrants | Portugal | 9.5 /100 | #216 | Tragic 26.7% |
| Brazilians | 9.2 /100 | #217 | Tragic 26.7% |
| Immigrants | Saudi Arabia | 9.1 /100 | #218 | Tragic 26.7% |