Immigrants from Denmark vs Mongolian Wage/Income Gap
COMPARE
Immigrants from Denmark
Mongolian
Wage/Income Gap
Wage/Income Gap Comparison
Immigrants from Denmark
Mongolians
28.5%
WAGE/INCOME GAP
0.1/ 100
METRIC RATING
307th/ 347
METRIC RANK
26.6%
WAGE/INCOME GAP
11.4/ 100
METRIC RATING
211th/ 347
METRIC RANK
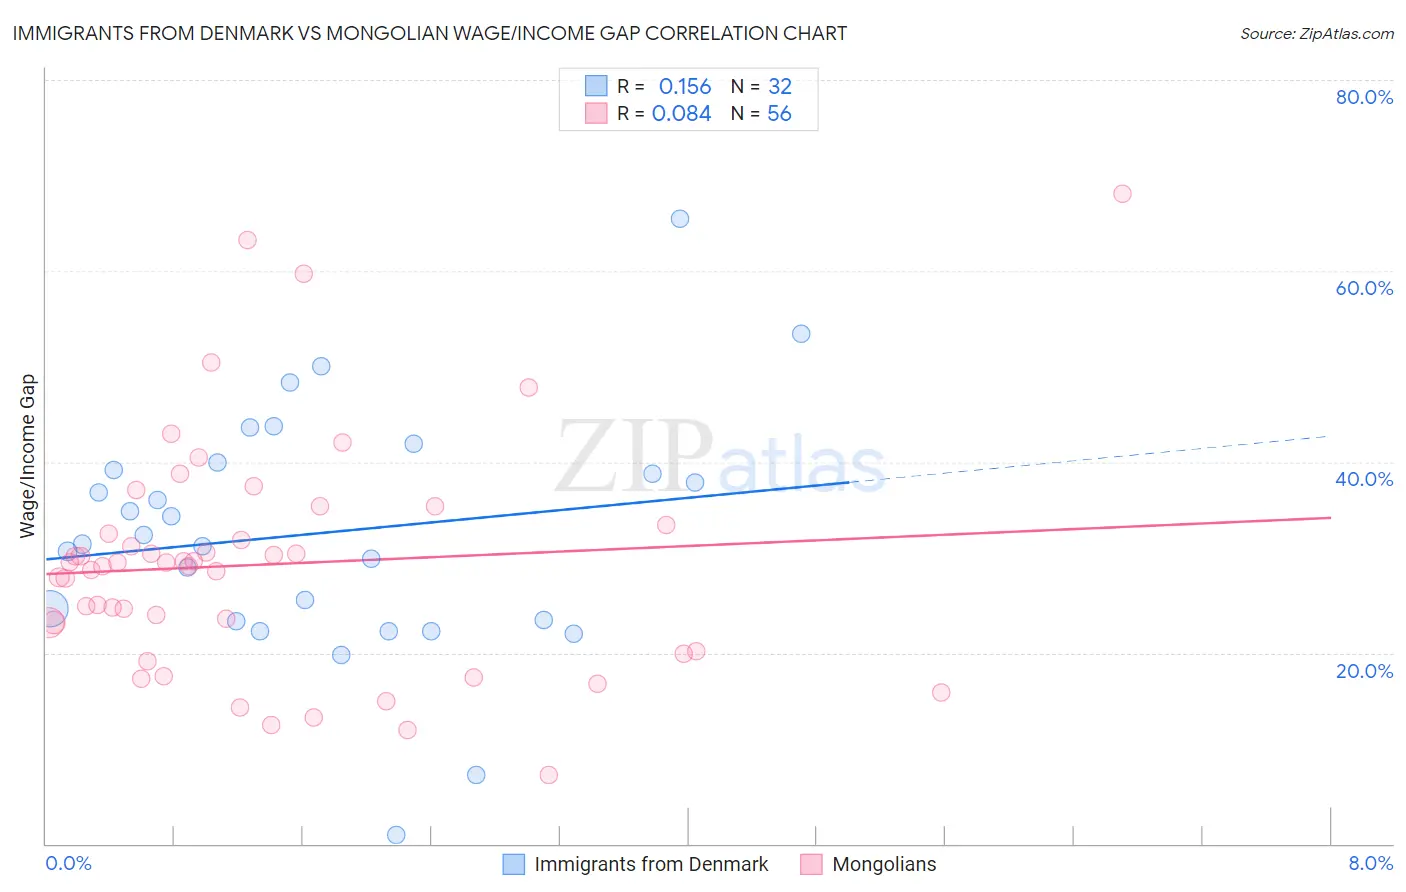
Immigrants from Denmark vs Mongolian Wage/Income Gap Correlation Chart
The statistical analysis conducted on geographies consisting of 136,393,196 people shows a poor positive correlation between the proportion of Immigrants from Denmark and wage/income gap percentage in the United States with a correlation coefficient (R) of 0.156 and weighted average of 28.5%. Similarly, the statistical analysis conducted on geographies consisting of 140,332,926 people shows a slight positive correlation between the proportion of Mongolians and wage/income gap percentage in the United States with a correlation coefficient (R) of 0.084 and weighted average of 26.6%, a difference of 7.1%.
Wage/Income Gap Correlation Summary
| Measurement | Immigrants from Denmark | Mongolian |
| Minimum | 0.92% | 7.3% |
| Maximum | 65.5% | 68.0% |
| Range | 64.6% | 60.8% |
| Mean | 32.6% | 29.3% |
| Median | 31.9% | 29.2% |
| Interquartile 25% (IQ1) | 23.4% | 21.7% |
| Interquartile 75% (IQ3) | 39.5% | 32.9% |
| Interquartile Range (IQR) | 16.2% | 11.2% |
| Standard Deviation (Sample) | 12.9% | 12.2% |
| Standard Deviation (Population) | 12.7% | 12.1% |
Similar Demographics by Wage/Income Gap
Demographics Similar to Immigrants from Denmark by Wage/Income Gap
In terms of wage/income gap, the demographic groups most similar to Immigrants from Denmark are White/Caucasian (28.5%, a difference of 0.010%), Immigrants from South Africa (28.5%, a difference of 0.050%), Immigrants from Netherlands (28.5%, a difference of 0.070%), Polish (28.5%, a difference of 0.070%), and Scotch-Irish (28.5%, a difference of 0.15%).
| Demographics | Rating | Rank | Wage/Income Gap |
| Immigrants | Northern Europe | 0.2 /100 | #300 | Tragic 28.5% |
| Immigrants | Canada | 0.2 /100 | #301 | Tragic 28.5% |
| Scotch-Irish | 0.2 /100 | #302 | Tragic 28.5% |
| Irish | 0.2 /100 | #303 | Tragic 28.5% |
| Immigrants | Netherlands | 0.2 /100 | #304 | Tragic 28.5% |
| Immigrants | South Africa | 0.1 /100 | #305 | Tragic 28.5% |
| Whites/Caucasians | 0.1 /100 | #306 | Tragic 28.5% |
| Immigrants | Denmark | 0.1 /100 | #307 | Tragic 28.5% |
| Poles | 0.1 /100 | #308 | Tragic 28.5% |
| Macedonians | 0.1 /100 | #309 | Tragic 28.6% |
| Finns | 0.1 /100 | #310 | Tragic 28.6% |
| Immigrants | Lithuania | 0.1 /100 | #311 | Tragic 28.6% |
| Eastern Europeans | 0.1 /100 | #312 | Tragic 28.6% |
| French | 0.1 /100 | #313 | Tragic 28.7% |
| Immigrants | Scotland | 0.1 /100 | #314 | Tragic 28.7% |
Demographics Similar to Mongolians by Wage/Income Gap
In terms of wage/income gap, the demographic groups most similar to Mongolians are Iraqi (26.6%, a difference of 0.030%), Arab (26.6%, a difference of 0.13%), Immigrants from Kuwait (26.6%, a difference of 0.17%), Immigrants from Iraq (26.7%, a difference of 0.18%), and Egyptian (26.6%, a difference of 0.19%).
| Demographics | Rating | Rank | Wage/Income Gap |
| Immigrants | Russia | 19.0 /100 | #204 | Poor 26.4% |
| Immigrants | Southern Europe | 17.3 /100 | #205 | Poor 26.4% |
| Indians (Asian) | 16.5 /100 | #206 | Poor 26.4% |
| Immigrants | Italy | 15.8 /100 | #207 | Poor 26.5% |
| Egyptians | 12.7 /100 | #208 | Poor 26.6% |
| Immigrants | Kuwait | 12.6 /100 | #209 | Poor 26.6% |
| Arabs | 12.3 /100 | #210 | Poor 26.6% |
| Mongolians | 11.4 /100 | #211 | Poor 26.6% |
| Iraqis | 11.2 /100 | #212 | Poor 26.6% |
| Immigrants | Iraq | 10.3 /100 | #213 | Poor 26.7% |
| Immigrants | China | 10.3 /100 | #214 | Poor 26.7% |
| Yugoslavians | 9.7 /100 | #215 | Tragic 26.7% |
| Immigrants | Portugal | 9.5 /100 | #216 | Tragic 26.7% |
| Brazilians | 9.2 /100 | #217 | Tragic 26.7% |
| Immigrants | Saudi Arabia | 9.1 /100 | #218 | Tragic 26.7% |