Cypriot vs Sudanese Wage/Income Gap
COMPARE
Cypriot
Sudanese
Wage/Income Gap
Wage/Income Gap Comparison
Cypriots
Sudanese
27.3%
WAGE/INCOME GAP
2.8/ 100
METRIC RATING
248th/ 347
METRIC RANK
24.0%
WAGE/INCOME GAP
98.6/ 100
METRIC RATING
106th/ 347
METRIC RANK
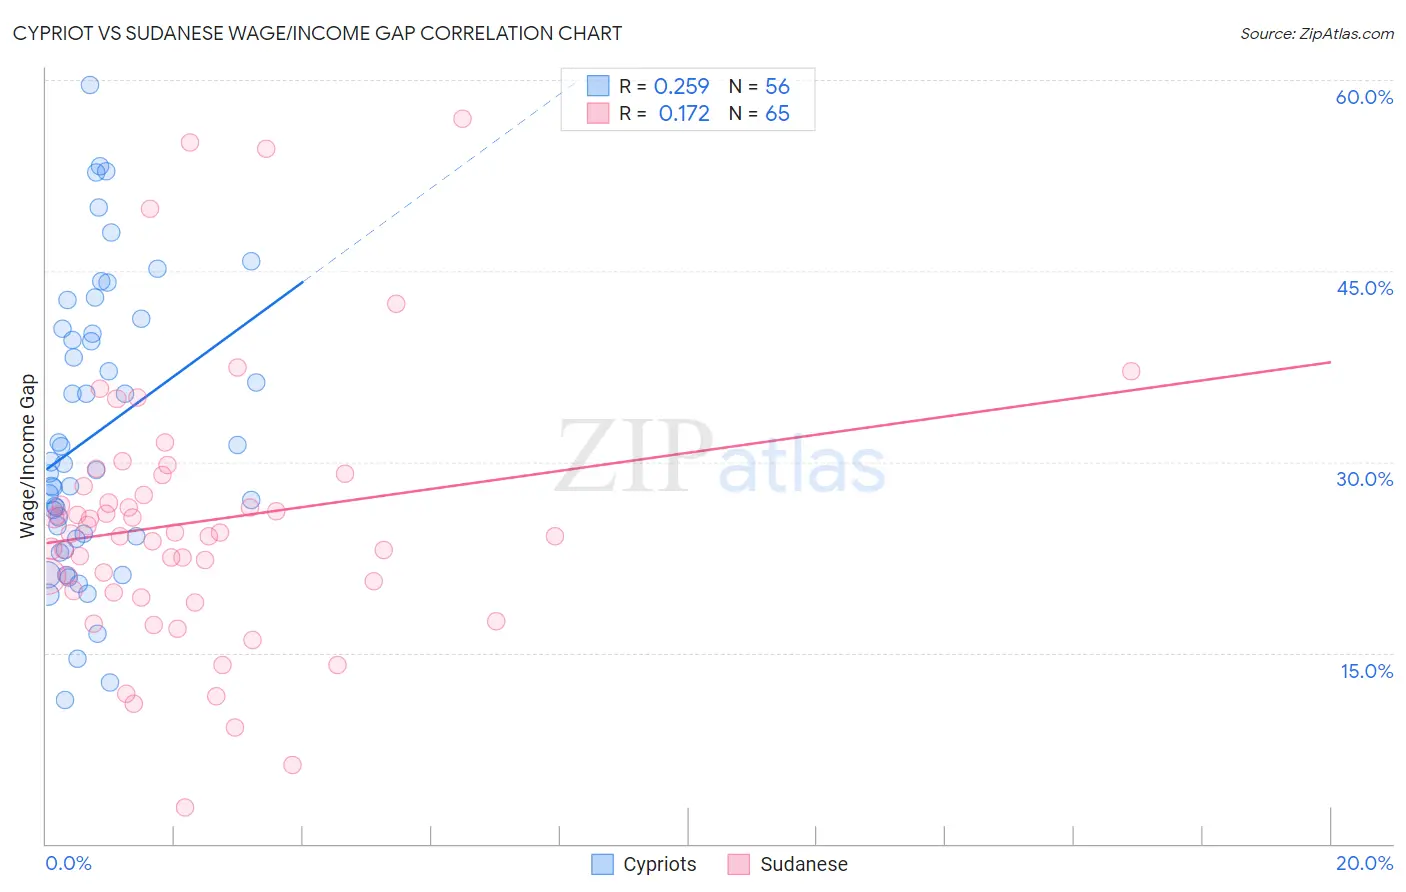
Cypriot vs Sudanese Wage/Income Gap Correlation Chart
The statistical analysis conducted on geographies consisting of 61,856,994 people shows a weak positive correlation between the proportion of Cypriots and wage/income gap percentage in the United States with a correlation coefficient (R) of 0.259 and weighted average of 27.3%. Similarly, the statistical analysis conducted on geographies consisting of 110,137,657 people shows a poor positive correlation between the proportion of Sudanese and wage/income gap percentage in the United States with a correlation coefficient (R) of 0.172 and weighted average of 24.0%, a difference of 13.8%.
Wage/Income Gap Correlation Summary
| Measurement | Cypriot | Sudanese |
| Minimum | 11.3% | 2.9% |
| Maximum | 59.6% | 56.9% |
| Range | 48.3% | 54.1% |
| Mean | 32.1% | 25.2% |
| Median | 29.6% | 24.4% |
| Interquartile 25% (IQ1) | 24.1% | 19.8% |
| Interquartile 75% (IQ3) | 40.2% | 28.6% |
| Interquartile Range (IQR) | 16.2% | 8.8% |
| Standard Deviation (Sample) | 11.2% | 10.4% |
| Standard Deviation (Population) | 11.1% | 10.3% |
Similar Demographics by Wage/Income Gap
Demographics Similar to Cypriots by Wage/Income Gap
In terms of wage/income gap, the demographic groups most similar to Cypriots are Carpatho Rusyn (27.3%, a difference of 0.0%), Celtic (27.3%, a difference of 0.010%), Immigrants from Czechoslovakia (27.3%, a difference of 0.020%), Immigrants from Norway (27.3%, a difference of 0.13%), and Ukrainian (27.3%, a difference of 0.19%).
| Demographics | Rating | Rank | Wage/Income Gap |
| Creek | 3.8 /100 | #241 | Tragic 27.1% |
| Immigrants | Sri Lanka | 3.7 /100 | #242 | Tragic 27.1% |
| Spanish | 3.6 /100 | #243 | Tragic 27.1% |
| Chickasaw | 3.5 /100 | #244 | Tragic 27.2% |
| Immigrants | Azores | 3.5 /100 | #245 | Tragic 27.2% |
| Immigrants | Nonimmigrants | 3.3 /100 | #246 | Tragic 27.2% |
| Celtics | 2.8 /100 | #247 | Tragic 27.3% |
| Cypriots | 2.8 /100 | #248 | Tragic 27.3% |
| Carpatho Rusyns | 2.7 /100 | #249 | Tragic 27.3% |
| Immigrants | Czechoslovakia | 2.7 /100 | #250 | Tragic 27.3% |
| Immigrants | Norway | 2.5 /100 | #251 | Tragic 27.3% |
| Ukrainians | 2.4 /100 | #252 | Tragic 27.3% |
| Portuguese | 2.2 /100 | #253 | Tragic 27.4% |
| Israelis | 2.1 /100 | #254 | Tragic 27.4% |
| Immigrants | France | 2.1 /100 | #255 | Tragic 27.4% |
Demographics Similar to Sudanese by Wage/Income Gap
In terms of wage/income gap, the demographic groups most similar to Sudanese are Moroccan (24.0%, a difference of 0.0%), Tlingit-Haida (24.0%, a difference of 0.060%), Yaqui (24.0%, a difference of 0.30%), Immigrants from Albania (24.0%, a difference of 0.31%), and Ugandan (24.1%, a difference of 0.36%).
| Demographics | Rating | Rank | Wage/Income Gap |
| Aleuts | 99.2 /100 | #99 | Exceptional 23.7% |
| Yakama | 99.2 /100 | #100 | Exceptional 23.7% |
| Japanese | 99.1 /100 | #101 | Exceptional 23.8% |
| Immigrants | Laos | 99.0 /100 | #102 | Exceptional 23.8% |
| Tsimshian | 98.9 /100 | #103 | Exceptional 23.9% |
| Tlingit-Haida | 98.7 /100 | #104 | Exceptional 24.0% |
| Moroccans | 98.6 /100 | #105 | Exceptional 24.0% |
| Sudanese | 98.6 /100 | #106 | Exceptional 24.0% |
| Yaqui | 98.4 /100 | #107 | Exceptional 24.0% |
| Immigrants | Albania | 98.4 /100 | #108 | Exceptional 24.0% |
| Ugandans | 98.3 /100 | #109 | Exceptional 24.1% |
| Immigrants | Morocco | 98.1 /100 | #110 | Exceptional 24.1% |
| Soviet Union | 97.6 /100 | #111 | Exceptional 24.2% |
| Immigrants | Colombia | 97.0 /100 | #112 | Exceptional 24.3% |
| Sioux | 96.9 /100 | #113 | Exceptional 24.3% |