Puerto Rican vs Sudanese Median Male Earnings
COMPARE
Puerto Rican
Sudanese
Median Male Earnings
Median Male Earnings Comparison
Puerto Ricans
Sudanese
$40,071
MEDIAN MALE EARNINGS
0.0/ 100
METRIC RATING
345th/ 347
METRIC RANK
$51,216
MEDIAN MALE EARNINGS
3.9/ 100
METRIC RATING
232nd/ 347
METRIC RANK
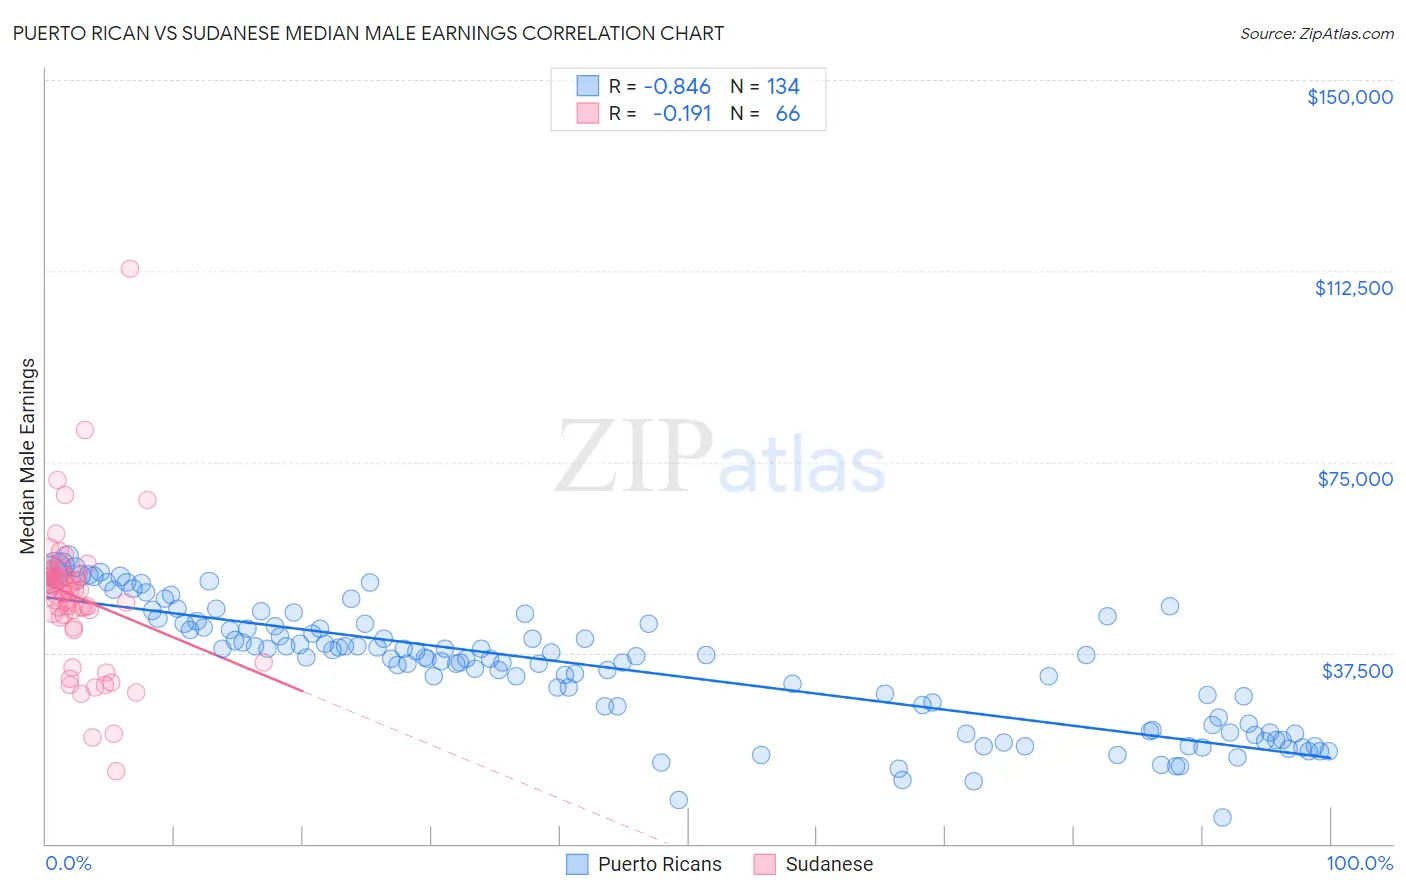
Puerto Rican vs Sudanese Median Male Earnings Correlation Chart
The statistical analysis conducted on geographies consisting of 527,834,370 people shows a very strong negative correlation between the proportion of Puerto Ricans and median male earnings in the United States with a correlation coefficient (R) of -0.846 and weighted average of $40,071. Similarly, the statistical analysis conducted on geographies consisting of 110,150,959 people shows a poor negative correlation between the proportion of Sudanese and median male earnings in the United States with a correlation coefficient (R) of -0.191 and weighted average of $51,216, a difference of 27.8%.
Median Male Earnings Correlation Summary
| Measurement | Puerto Rican | Sudanese |
| Minimum | $5,183 | $14,310 |
| Maximum | $56,414 | $113,008 |
| Range | $51,231 | $98,698 |
| Mean | $34,723 | $48,489 |
| Median | $36,571 | $49,650 |
| Interquartile 25% (IQ1) | $23,294 | $44,972 |
| Interquartile 75% (IQ3) | $43,124 | $53,130 |
| Interquartile Range (IQR) | $19,830 | $8,158 |
| Standard Deviation (Sample) | $11,965 | $14,082 |
| Standard Deviation (Population) | $11,920 | $13,975 |
Similar Demographics by Median Male Earnings
Demographics Similar to Puerto Ricans by Median Male Earnings
In terms of median male earnings, the demographic groups most similar to Puerto Ricans are Tohono O'odham ($39,543, a difference of 1.3%), Yup'ik ($39,504, a difference of 1.4%), Pueblo ($41,314, a difference of 3.1%), Lumbee ($41,715, a difference of 4.1%), and Arapaho ($41,758, a difference of 4.2%).
| Demographics | Rating | Rank | Median Male Earnings |
| Immigrants | Congo | 0.0 /100 | #333 | Tragic $44,204 |
| Immigrants | Yemen | 0.0 /100 | #334 | Tragic $44,083 |
| Spanish American Indians | 0.0 /100 | #335 | Tragic $44,010 |
| Immigrants | Cuba | 0.0 /100 | #336 | Tragic $43,461 |
| Menominee | 0.0 /100 | #337 | Tragic $42,581 |
| Crow | 0.0 /100 | #338 | Tragic $42,434 |
| Pima | 0.0 /100 | #339 | Tragic $42,357 |
| Navajo | 0.0 /100 | #340 | Tragic $42,098 |
| Hopi | 0.0 /100 | #341 | Tragic $42,060 |
| Arapaho | 0.0 /100 | #342 | Tragic $41,758 |
| Lumbee | 0.0 /100 | #343 | Tragic $41,715 |
| Pueblo | 0.0 /100 | #344 | Tragic $41,314 |
| Puerto Ricans | 0.0 /100 | #345 | Tragic $40,071 |
| Tohono O'odham | 0.0 /100 | #346 | Tragic $39,543 |
| Yup'ik | 0.0 /100 | #347 | Tragic $39,504 |
Demographics Similar to Sudanese by Median Male Earnings
In terms of median male earnings, the demographic groups most similar to Sudanese are Barbadian ($51,236, a difference of 0.040%), Aleut ($51,168, a difference of 0.090%), Immigrants from Nigeria ($51,310, a difference of 0.18%), Cape Verdean ($51,103, a difference of 0.22%), and Immigrants from Trinidad and Tobago ($51,376, a difference of 0.31%).
| Demographics | Rating | Rank | Median Male Earnings |
| Immigrants | Sudan | 5.0 /100 | #225 | Tragic $51,489 |
| Japanese | 4.9 /100 | #226 | Tragic $51,473 |
| Trinidadians and Tobagonians | 4.8 /100 | #227 | Tragic $51,446 |
| Samoans | 4.6 /100 | #228 | Tragic $51,389 |
| Immigrants | Trinidad and Tobago | 4.5 /100 | #229 | Tragic $51,376 |
| Immigrants | Nigeria | 4.2 /100 | #230 | Tragic $51,310 |
| Barbadians | 3.9 /100 | #231 | Tragic $51,236 |
| Sudanese | 3.9 /100 | #232 | Tragic $51,216 |
| Aleuts | 3.7 /100 | #233 | Tragic $51,168 |
| Cape Verdeans | 3.5 /100 | #234 | Tragic $51,103 |
| Immigrants | Western Africa | 3.0 /100 | #235 | Tragic $50,940 |
| Pennsylvania Germans | 2.8 /100 | #236 | Tragic $50,878 |
| Immigrants | Barbados | 2.6 /100 | #237 | Tragic $50,795 |
| Malaysians | 2.5 /100 | #238 | Tragic $50,772 |
| Americans | 2.5 /100 | #239 | Tragic $50,761 |