Native Hawaiian vs Chippewa Child Poverty Among Girls Under 16
COMPARE
Native Hawaiian
Chippewa
Child Poverty Among Girls Under 16
Child Poverty Among Girls Under 16 Comparison
Native Hawaiians
Chippewa
15.5%
CHILD POVERTY AMONG GIRLS UNDER 16
89.0/ 100
METRIC RATING
136th/ 347
METRIC RANK
20.6%
CHILD POVERTY AMONG GIRLS UNDER 16
0.0/ 100
METRIC RATING
291st/ 347
METRIC RANK
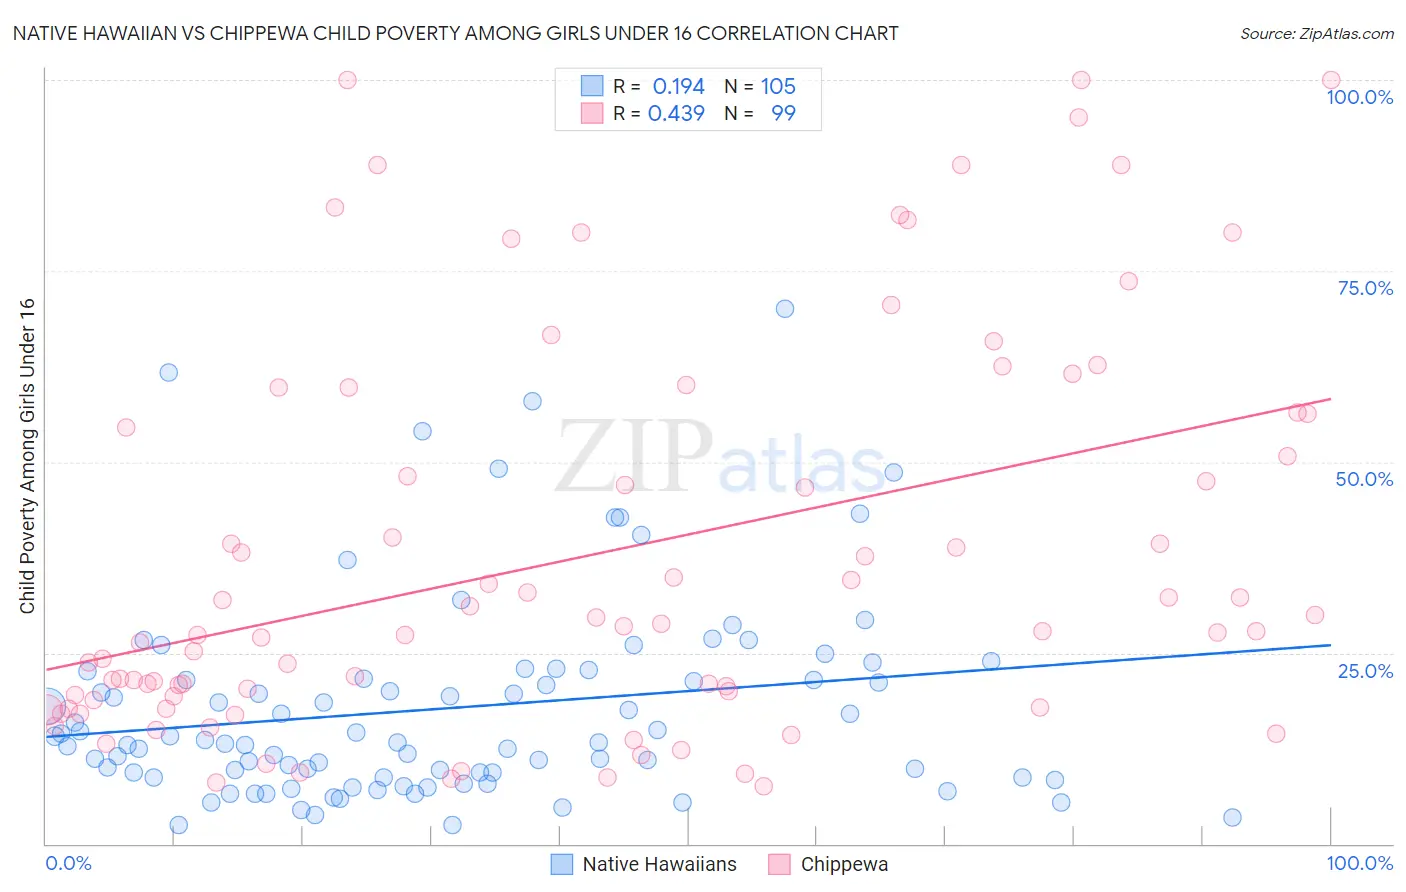
Native Hawaiian vs Chippewa Child Poverty Among Girls Under 16 Correlation Chart
The statistical analysis conducted on geographies consisting of 328,090,370 people shows a poor positive correlation between the proportion of Native Hawaiians and poverty level among girls under the age of 16 in the United States with a correlation coefficient (R) of 0.194 and weighted average of 15.5%. Similarly, the statistical analysis conducted on geographies consisting of 212,813,465 people shows a moderate positive correlation between the proportion of Chippewa and poverty level among girls under the age of 16 in the United States with a correlation coefficient (R) of 0.439 and weighted average of 20.6%, a difference of 33.3%.
Child Poverty Among Girls Under 16 Correlation Summary
| Measurement | Native Hawaiian | Chippewa |
| Minimum | 2.4% | 7.5% |
| Maximum | 70.0% | 100.0% |
| Range | 67.6% | 92.5% |
| Mean | 17.7% | 37.7% |
| Median | 13.3% | 27.8% |
| Interquartile 25% (IQ1) | 8.7% | 18.9% |
| Interquartile 75% (IQ3) | 22.1% | 56.3% |
| Interquartile Range (IQR) | 13.4% | 37.5% |
| Standard Deviation (Sample) | 13.3% | 25.5% |
| Standard Deviation (Population) | 13.2% | 25.4% |
Similar Demographics by Child Poverty Among Girls Under 16
Demographics Similar to Native Hawaiians by Child Poverty Among Girls Under 16
In terms of child poverty among girls under 16, the demographic groups most similar to Native Hawaiians are Czechoslovakian (15.5%, a difference of 0.020%), Immigrants from Spain (15.5%, a difference of 0.050%), South African (15.5%, a difference of 0.090%), Brazilian (15.4%, a difference of 0.21%), and Immigrants from Vietnam (15.5%, a difference of 0.22%).
| Demographics | Rating | Rank | Child Poverty Among Girls Under 16 |
| Immigrants | South Eastern Asia | 90.5 /100 | #129 | Exceptional 15.4% |
| Puget Sound Salish | 90.1 /100 | #130 | Exceptional 15.4% |
| Immigrants | Western Europe | 90.0 /100 | #131 | Exceptional 15.4% |
| Mongolians | 89.7 /100 | #132 | Excellent 15.4% |
| Brazilians | 89.6 /100 | #133 | Excellent 15.4% |
| Immigrants | Spain | 89.1 /100 | #134 | Excellent 15.5% |
| Czechoslovakians | 89.0 /100 | #135 | Excellent 15.5% |
| Native Hawaiians | 89.0 /100 | #136 | Excellent 15.5% |
| South Africans | 88.7 /100 | #137 | Excellent 15.5% |
| Immigrants | Vietnam | 88.2 /100 | #138 | Excellent 15.5% |
| Armenians | 87.9 /100 | #139 | Excellent 15.5% |
| New Zealanders | 87.2 /100 | #140 | Excellent 15.6% |
| Immigrants | Jordan | 87.2 /100 | #141 | Excellent 15.6% |
| Canadians | 87.1 /100 | #142 | Excellent 15.6% |
| Immigrants | Peru | 86.6 /100 | #143 | Excellent 15.6% |
Demographics Similar to Chippewa by Child Poverty Among Girls Under 16
In terms of child poverty among girls under 16, the demographic groups most similar to Chippewa are Immigrants from Latin America (20.6%, a difference of 0.070%), Immigrants from Grenada (20.7%, a difference of 0.11%), Immigrants from Haiti (20.6%, a difference of 0.13%), Immigrants from Belize (20.6%, a difference of 0.20%), and Immigrants from Senegal (20.7%, a difference of 0.22%).
| Demographics | Rating | Rank | Child Poverty Among Girls Under 16 |
| Yaqui | 0.0 /100 | #284 | Tragic 20.3% |
| Immigrants | Cabo Verde | 0.0 /100 | #285 | Tragic 20.3% |
| Iroquois | 0.0 /100 | #286 | Tragic 20.4% |
| Blackfeet | 0.0 /100 | #287 | Tragic 20.5% |
| Haitians | 0.0 /100 | #288 | Tragic 20.5% |
| Immigrants | Belize | 0.0 /100 | #289 | Tragic 20.6% |
| Immigrants | Haiti | 0.0 /100 | #290 | Tragic 20.6% |
| Chippewa | 0.0 /100 | #291 | Tragic 20.6% |
| Immigrants | Latin America | 0.0 /100 | #292 | Tragic 20.6% |
| Immigrants | Grenada | 0.0 /100 | #293 | Tragic 20.7% |
| Immigrants | Senegal | 0.0 /100 | #294 | Tragic 20.7% |
| Immigrants | Caribbean | 0.0 /100 | #295 | Tragic 20.7% |
| Immigrants | West Indies | 0.0 /100 | #296 | Tragic 20.7% |
| Inupiat | 0.0 /100 | #297 | Tragic 20.8% |
| Mexicans | 0.0 /100 | #298 | Tragic 20.9% |