Native Hawaiian vs Immigrants from England Wage/Income Gap

COMPARE

Native Hawaiian
Race
Ancestry
AfghanAfricanAlaska NativeAlaskan AthabascanAlbanianAleutAlsatianAmericanApacheArabArapahoArgentineanArmenianAssyrian/Chaldean/SyriacAustralianAustrianBahamianBangladeshiBarbadianBasqueBelgianBelizeanBermudanBhutaneseBlackfeetBolivianBrazilianBritishBritish West IndianBulgarianBurmeseCajunCambodianCanadianCape VerdeanCarpatho RusynCelticCentral AmericanCentral American IndianCherokeeCheyenneChickasawChileanChineseChippewaChoctawColombianColvilleComancheCosta RicanCreeCreekCroatianCrowCubanCypriotCzechCzechoslovakianDanishDelawareDominicanDutchDutch West IndianEastern EuropeanEcuadorianEgyptianEnglishEstonianEthiopianEuropeanFijianFilipinoFinnishFrenchFrench American IndianFrench CanadianGermanGerman RussianGhanaianGreekGuamanian/ChamorroGuatemalanGuyaneseHaitianHmongHonduranHopiHoumaHungarianIcelanderIndian (Asian)IndonesianInupiatIranianIraqiIrishIroquoisIsraeliItalianJamaicanJapaneseJordanianKenyanKiowaKoreanLaotianLatvianLebaneseLiberianLithuanianLumbeeLuxembourgerMacedonianMalaysianMalteseMarshalleseMenomineeMexicanMexican American IndianMongolianMoroccanNative HawaiianNavajoNepaleseNew ZealanderNicaraguanNigerianNorthern EuropeanNorwegianOkinawanOsageOttawaPaiutePakistaniPalestinianPanamanianParaguayanPennsylvania GermanPeruvianPimaPolishPortuguesePotawatomiPuebloPuerto RicanPuget Sound SalishRomanianRussianSalvadoranSamoanScandinavianScotch-IrishScottishSeminoleSenegaleseSerbianShoshoneSierra LeoneanSiouxSlavicSlovakSloveneSomaliSouth AfricanSouth AmericanSouth American IndianSoviet UnionSpaniardSpanishSpanish AmericanSpanish American IndianSri LankanSubsaharan AfricanSudaneseSwedishSwissSyrianTaiwaneseThaiTlingit-HaidaTohono O'OdhamTonganTrinidadian and TobagonianTsimshianTurkishU.S. Virgin IslanderUgandanUkrainianUruguayanUteVenezuelanVietnameseWelshWest IndianYakamaYaquiYugoslavianYumanYup'ikZimbabwean
Immigration
NonimmigrantsImmigrantsAfghanistanAfricaAlbaniaArgentinaArmeniaAsiaAustraliaAustriaBahamasBangladeshBarbadosBelarusBelgiumBelizeBoliviaBosnia and HerzegovinaBrazilBulgariaBurma/MyanmarCabo VerdeCambodiaCameroonCanadaCaribbeanCentral AmericaChileChinaColombiaCongoCosta RicaCroatiaCubaCzechoslovakiaDenmarkDominicaDominican RepublicEastern AfricaEastern AsiaEastern EuropeEcuadorEgyptEl SalvadorEritreaEthiopiaEuropeFijiFranceGermanyGhanaGreeceGrenadaGuatemalaGuyanaHaitiHondurasHong KongHungaryIndiaIndonesiaIranIraqIrelandIsraelItalyJamaicaJapanJordanKazakhstanKenyaKoreaKuwaitLaosLatin AmericaLatviaLebanonLiberiaLithuaniaMalaysiaMexicoMicronesiaMiddle AfricaMoldovaMoroccoNepalNetherlandsNicaraguaNigeriaNorth AmericaNorth MacedoniaNorthern AfricaNorthern EuropeNorwayOceaniaPakistanPanamaPeruPhilippinesPolandPortugalRomaniaRussiaSaudi ArabiaScotlandSenegalSerbiaSierra LeoneSingaporeSomaliaSouth AfricaSouth AmericaSouth Central AsiaSouth Eastern AsiaSouthern EuropeSpainSri LankaSt. Vincent and the GrenadinesSudanSwedenSwitzerlandSyriaTaiwanThailandTrinidad and TobagoTurkeyUgandaUkraineUruguayUzbekistanVenezuelaVietnamWest IndiesWestern AfricaWestern AsiaWestern EuropeYemenZaireZimbabweAzores
Immigrants from England
Race
Ancestry
AfghanAfricanAlaska NativeAlaskan AthabascanAlbanianAleutAlsatianAmericanApacheArabArapahoArgentineanArmenianAssyrian/Chaldean/SyriacAustralianAustrianBahamianBangladeshiBarbadianBasqueBelgianBelizeanBermudanBhutaneseBlackfeetBolivianBrazilianBritishBritish West IndianBulgarianBurmeseCajunCambodianCanadianCape VerdeanCarpatho RusynCelticCentral AmericanCentral American IndianCherokeeCheyenneChickasawChileanChineseChippewaChoctawColombianColvilleComancheCosta RicanCreeCreekCroatianCrowCubanCypriotCzechCzechoslovakianDanishDelawareDominicanDutchDutch West IndianEastern EuropeanEcuadorianEgyptianEnglishEstonianEthiopianEuropeanFijianFilipinoFinnishFrenchFrench American IndianFrench CanadianGermanGerman RussianGhanaianGreekGuamanian/ChamorroGuatemalanGuyaneseHaitianHmongHonduranHopiHoumaHungarianIcelanderIndian (Asian)IndonesianInupiatIranianIraqiIrishIroquoisIsraeliItalianJamaicanJapaneseJordanianKenyanKiowaKoreanLaotianLatvianLebaneseLiberianLithuanianLumbeeLuxembourgerMacedonianMalaysianMalteseMarshalleseMenomineeMexicanMexican American IndianMongolianMoroccanNavajoNepaleseNew ZealanderNicaraguanNigerianNorthern EuropeanNorwegianOkinawanOsageOttawaPaiutePakistaniPalestinianPanamanianParaguayanPennsylvania GermanPeruvianPimaPolishPortuguesePotawatomiPuebloPuerto RicanPuget Sound SalishRomanianRussianSalvadoranSamoanScandinavianScotch-IrishScottishSeminoleSenegaleseSerbianShoshoneSierra LeoneanSiouxSlavicSlovakSloveneSomaliSouth AfricanSouth AmericanSouth American IndianSoviet UnionSpaniardSpanishSpanish AmericanSpanish American IndianSri LankanSubsaharan AfricanSudaneseSwedishSwissSyrianTaiwaneseThaiTlingit-HaidaTohono O'OdhamTonganTrinidadian and TobagonianTsimshianTurkishU.S. Virgin IslanderUgandanUkrainianUruguayanUteVenezuelanVietnameseWelshWest IndianYakamaYaquiYugoslavianYumanYup'ikZimbabwean
Immigration
NonimmigrantsImmigrantsAfghanistanAfricaAlbaniaArgentinaArmeniaAsiaAustraliaAustriaBahamasBangladeshBarbadosBelarusBelgiumBelizeBoliviaBosnia and HerzegovinaBrazilBulgariaBurma/MyanmarCabo VerdeCambodiaCameroonCanadaCaribbeanCentral AmericaChileChinaColombiaCongoCosta RicaCroatiaCubaCzechoslovakiaDenmarkDominicaDominican RepublicEastern AfricaEastern AsiaEastern EuropeEcuadorEgyptEl SalvadorEnglandEritreaEthiopiaEuropeFijiFranceGermanyGhanaGreeceGrenadaGuatemalaGuyanaHaitiHondurasHong KongHungaryIndiaIndonesiaIranIraqIrelandIsraelItalyJamaicaJapanJordanKazakhstanKenyaKoreaKuwaitLaosLatin AmericaLatviaLebanonLiberiaLithuaniaMalaysiaMexicoMicronesiaMiddle AfricaMoldovaMoroccoNepalNetherlandsNicaraguaNigeriaNorth AmericaNorth MacedoniaNorthern AfricaNorthern EuropeNorwayOceaniaPakistanPanamaPeruPhilippinesPolandPortugalRomaniaRussiaSaudi ArabiaScotlandSenegalSerbiaSierra LeoneSingaporeSomaliaSouth AfricaSouth AmericaSouth Central AsiaSouth Eastern AsiaSouthern EuropeSpainSri LankaSt. Vincent and the GrenadinesSudanSwedenSwitzerlandSyriaTaiwanThailandTrinidad and TobagoTurkeyUgandaUkraineUruguayUzbekistanVenezuelaVietnamWest IndiesWestern AfricaWestern AsiaWestern EuropeYemenZaireZimbabweAzores
Wage/Income Gap
Income
Poverty
Unemployment
Labor Participation
Family Structure
Vehicle Availability
Education Level
Disability

Wage/Income Gap Comparison

Native Hawaiians

Immigrants from England

Good
Tragic
25.4%
WAGE/INCOME GAP
69.0/ 100
METRIC RATING
163rd/ 347
METRIC RANK
27.9%
WAGE/INCOME GAP
0.6/ 100
METRIC RATING
278th/ 347
METRIC RANK

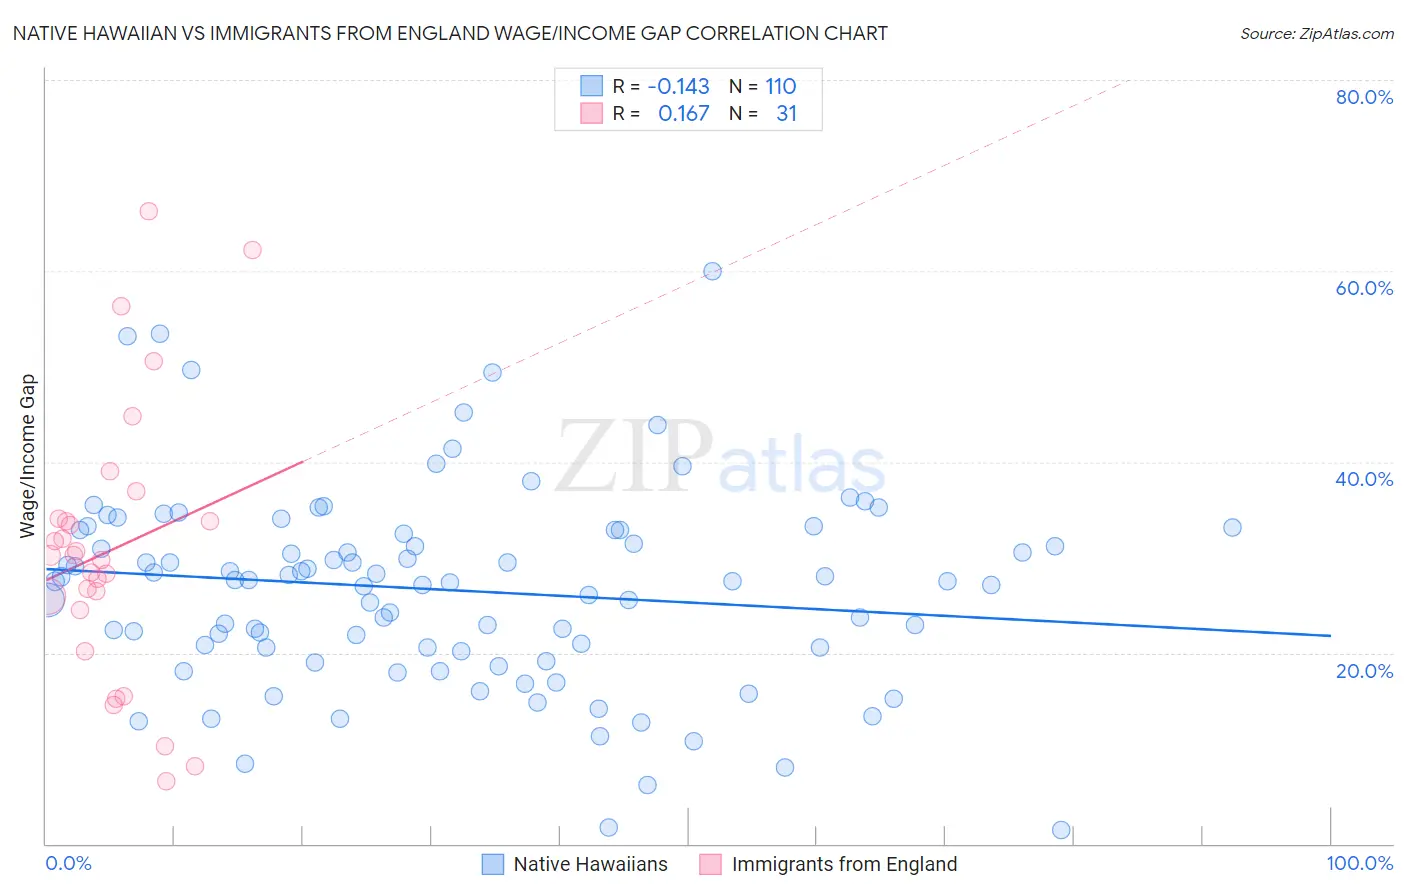
Native Hawaiian vs Immigrants from England Wage/Income Gap Correlation Chart

The statistical analysis conducted on geographies consisting of 331,867,759 people shows a poor negative correlation between the proportion of Native Hawaiians and wage/income gap percentage in the United States with a correlation coefficient (R) of -0.143 and weighted average of 25.4%. Similarly, the statistical analysis conducted on geographies consisting of 391,474,935 people shows a poor positive correlation between the proportion of Immigrants from England and wage/income gap percentage in the United States with a correlation coefficient (R) of 0.167 and weighted average of 27.9%, a difference of 9.7%.
Native Hawaiian vs Immigrants from England Wage/Income Gap

Wage/Income Gap Correlation Summary

MeasurementNative HawaiianImmigrants from England
Minimum1.4%6.6%
Maximum60.0%66.3%
Range58.6%59.7%
Mean26.6%30.8%
Median27.5%30.2%
Interquartile 25% (IQ1)20.6%24.5%
Interquartile 75% (IQ3)32.8%34.1%
Interquartile Range (IQR)12.2%9.6%
Standard Deviation (Sample)10.4%14.3%
Standard Deviation (Population)10.3%14.0%

Similar Demographics by Wage/Income Gap

Demographics Similar to Native Hawaiians by Wage/Income Gap

In terms of wage/income gap, the demographic groups most similar to Native Hawaiians are Shoshone (25.4%, a difference of 0.0%), Albanian (25.4%, a difference of 0.030%), Korean (25.4%, a difference of 0.030%), French American Indian (25.4%, a difference of 0.29%), and Puget Sound Salish (25.3%, a difference of 0.33%).
DemographicsRating | RankWage/Income Gap
Immigrants | Mexico
76.4
/100
|
#156
Good
25.3%
Costa Ricans
75.8
/100
|
#157
Good
25.3%
Immigrants | Zimbabwe
73.7
/100
|
#158
Good
25.3%
Puget Sound Salish
73.0
/100
|
#159
Good
25.3%
French American Indians
72.5
/100
|
#160
Good
25.4%
Albanians
69.4
/100
|
#161
Good
25.4%
Shoshone
69.0
/100
|
#162
Good
25.4%
Native Hawaiians
69.0
/100
|
#163
Good
25.4%
Koreans
68.6
/100
|
#164
Good
25.4%
Immigrants | Hong Kong
64.0
/100
|
#165
Good
25.5%
Immigrants | Ukraine
63.8
/100
|
#166
Good
25.5%
Paiute
62.9
/100
|
#167
Good
25.5%
Seminole
62.6
/100
|
#168
Good
25.6%
Peruvians
60.1
/100
|
#169
Good
25.6%
Immigrants | Oceania
57.5
/100
|
#170
Average
25.6%

Demographics Similar to Immigrants from England by Wage/Income Gap

In terms of wage/income gap, the demographic groups most similar to Immigrants from England are Lebanese (27.9%, a difference of 0.080%), Latvian (27.9%, a difference of 0.080%), Immigrants from Japan (27.9%, a difference of 0.11%), American (27.8%, a difference of 0.19%), and Bulgarian (27.8%, a difference of 0.23%).
DemographicsRating | RankWage/Income Gap
Ute
0.8
/100
|
#271
Tragic
27.8%
Immigrants | Korea
0.8
/100
|
#272
Tragic
27.8%
Bulgarians
0.7
/100
|
#273
Tragic
27.8%
Americans
0.7
/100
|
#274
Tragic
27.8%
Immigrants | Japan
0.7
/100
|
#275
Tragic
27.9%
Lebanese
0.7
/100
|
#276
Tragic
27.9%
Latvians
0.7
/100
|
#277
Tragic
27.9%
Immigrants | England
0.6
/100
|
#278
Tragic
27.9%
Romanians
0.5
/100
|
#279
Tragic
28.0%
Russians
0.5
/100
|
#280
Tragic
28.0%
Burmese
0.5
/100
|
#281
Tragic
28.0%
South Africans
0.5
/100
|
#282
Tragic
28.0%
French Canadians
0.4
/100
|
#283
Tragic
28.1%
Immigrants | Sweden
0.4
/100
|
#284
Tragic
28.1%
Italians
0.4
/100
|
#285
Tragic
28.1%