Maltese vs Immigrants from St. Vincent and the Grenadines Wage/Income Gap
COMPARE
Maltese
Immigrants from St. Vincent and the Grenadines
Wage/Income Gap
Wage/Income Gap Comparison
Maltese
Immigrants from St. Vincent and the Grenadines
28.7%
WAGE/INCOME GAP
0.1/ 100
METRIC RATING
315th/ 347
METRIC RANK
16.4%
WAGE/INCOME GAP
100.0/ 100
METRIC RATING
2nd/ 347
METRIC RANK
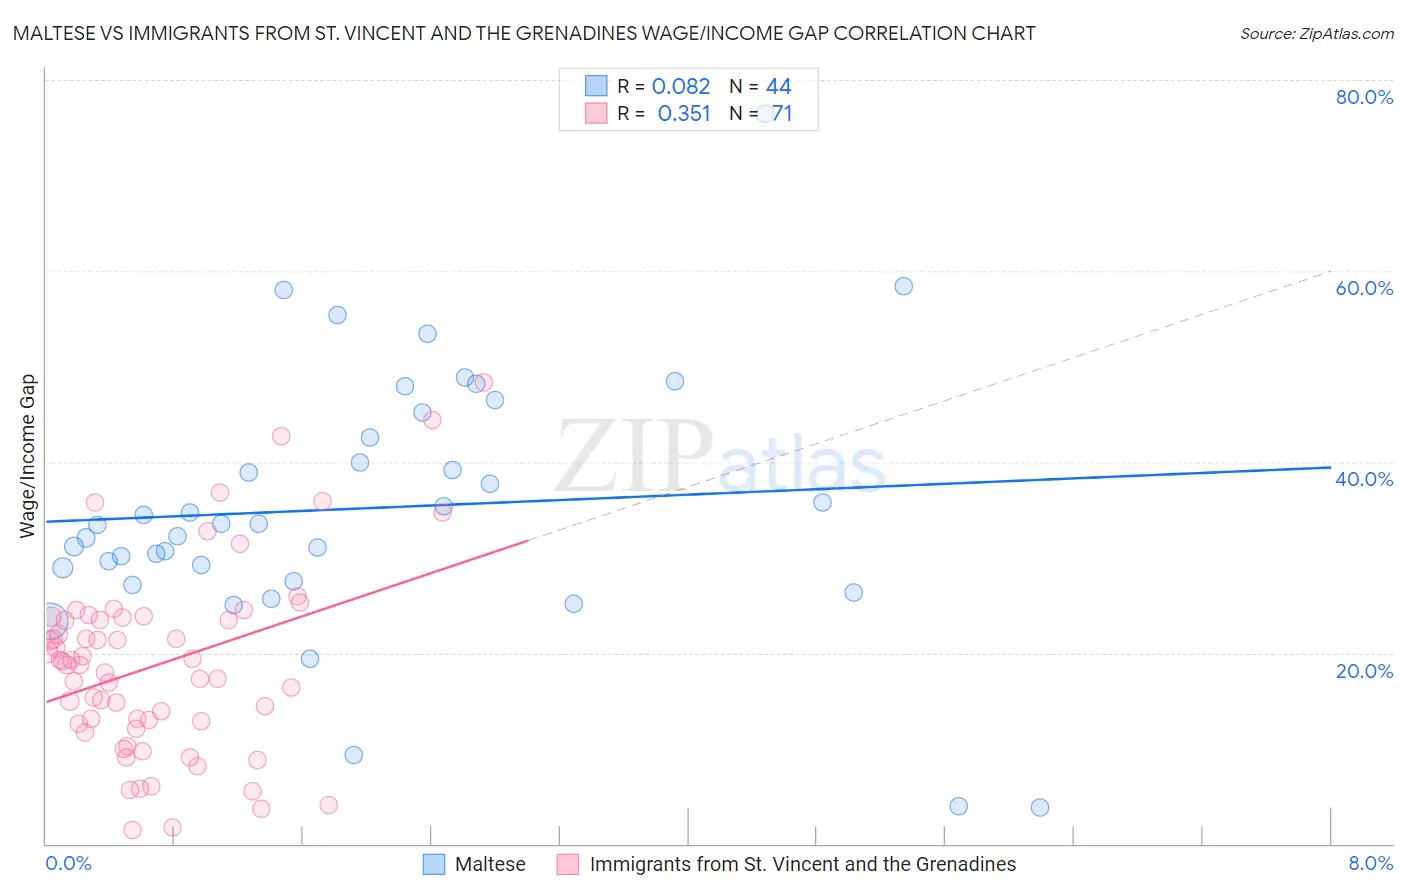
Maltese vs Immigrants from St. Vincent and the Grenadines Wage/Income Gap Correlation Chart
The statistical analysis conducted on geographies consisting of 126,452,733 people shows a slight positive correlation between the proportion of Maltese and wage/income gap percentage in the United States with a correlation coefficient (R) of 0.082 and weighted average of 28.7%. Similarly, the statistical analysis conducted on geographies consisting of 56,186,231 people shows a mild positive correlation between the proportion of Immigrants from St. Vincent and the Grenadines and wage/income gap percentage in the United States with a correlation coefficient (R) of 0.351 and weighted average of 16.4%, a difference of 75.0%.
Wage/Income Gap Correlation Summary
| Measurement | Maltese | Immigrants from St. Vincent and the Grenadines |
| Minimum | 3.8% | 1.4% |
| Maximum | 76.5% | 48.3% |
| Range | 72.8% | 46.9% |
| Mean | 35.2% | 18.8% |
| Median | 33.4% | 18.8% |
| Interquartile 25% (IQ1) | 28.2% | 12.5% |
| Interquartile 75% (IQ3) | 43.9% | 23.7% |
| Interquartile Range (IQR) | 15.7% | 11.2% |
| Standard Deviation (Sample) | 13.9% | 9.8% |
| Standard Deviation (Population) | 13.7% | 9.8% |
Similar Demographics by Wage/Income Gap
Demographics Similar to Maltese by Wage/Income Gap
In terms of wage/income gap, the demographic groups most similar to Maltese are Lithuanian (28.7%, a difference of 0.010%), Immigrants from Scotland (28.7%, a difference of 0.050%), Belgian (28.8%, a difference of 0.12%), Basque (28.8%, a difference of 0.17%), and French (28.7%, a difference of 0.19%).
| Demographics | Rating | Rank | Wage/Income Gap |
| Poles | 0.1 /100 | #308 | Tragic 28.5% |
| Macedonians | 0.1 /100 | #309 | Tragic 28.6% |
| Finns | 0.1 /100 | #310 | Tragic 28.6% |
| Immigrants | Lithuania | 0.1 /100 | #311 | Tragic 28.6% |
| Eastern Europeans | 0.1 /100 | #312 | Tragic 28.6% |
| French | 0.1 /100 | #313 | Tragic 28.7% |
| Immigrants | Scotland | 0.1 /100 | #314 | Tragic 28.7% |
| Maltese | 0.1 /100 | #315 | Tragic 28.7% |
| Lithuanians | 0.1 /100 | #316 | Tragic 28.7% |
| Belgians | 0.1 /100 | #317 | Tragic 28.8% |
| Basques | 0.1 /100 | #318 | Tragic 28.8% |
| Slovaks | 0.1 /100 | #319 | Tragic 28.9% |
| British | 0.1 /100 | #320 | Tragic 28.9% |
| Welsh | 0.1 /100 | #321 | Tragic 28.9% |
| Immigrants | Singapore | 0.1 /100 | #322 | Tragic 28.9% |
Demographics Similar to Immigrants from St. Vincent and the Grenadines by Wage/Income Gap
In terms of wage/income gap, the demographic groups most similar to Immigrants from St. Vincent and the Grenadines are Immigrants from Grenada (16.2%, a difference of 1.5%), Immigrants from Barbados (17.8%, a difference of 8.6%), British West Indian (18.0%, a difference of 9.7%), Guyanese (18.3%, a difference of 11.5%), and Immigrants from Guyana (18.4%, a difference of 11.8%).
| Demographics | Rating | Rank | Wage/Income Gap |
| Immigrants | Grenada | 100.0 /100 | #1 | Exceptional 16.2% |
| Immigrants | St. Vincent and the Grenadines | 100.0 /100 | #2 | Exceptional 16.4% |
| Immigrants | Barbados | 100.0 /100 | #3 | Exceptional 17.8% |
| British West Indians | 100.0 /100 | #4 | Exceptional 18.0% |
| Guyanese | 100.0 /100 | #5 | Exceptional 18.3% |
| Immigrants | Guyana | 100.0 /100 | #6 | Exceptional 18.4% |
| Puerto Ricans | 100.0 /100 | #7 | Exceptional 18.7% |
| Immigrants | Jamaica | 100.0 /100 | #8 | Exceptional 18.8% |
| Barbadians | 100.0 /100 | #9 | Exceptional 19.0% |
| Crow | 100.0 /100 | #10 | Exceptional 19.1% |
| Immigrants | Haiti | 100.0 /100 | #11 | Exceptional 19.2% |
| Immigrants | West Indies | 100.0 /100 | #12 | Exceptional 19.2% |
| Trinidadians and Tobagonians | 100.0 /100 | #13 | Exceptional 19.3% |
| Immigrants | Trinidad and Tobago | 100.0 /100 | #14 | Exceptional 19.3% |
| West Indians | 100.0 /100 | #15 | Exceptional 19.6% |