Iranian vs Immigrants from St. Vincent and the Grenadines Wage/Income Gap
COMPARE
Iranian
Immigrants from St. Vincent and the Grenadines
Wage/Income Gap
Wage/Income Gap Comparison
Iranians
Immigrants from St. Vincent and the Grenadines
29.7%
WAGE/INCOME GAP
0.0/ 100
METRIC RATING
339th/ 347
METRIC RANK
16.4%
WAGE/INCOME GAP
100.0/ 100
METRIC RATING
2nd/ 347
METRIC RANK
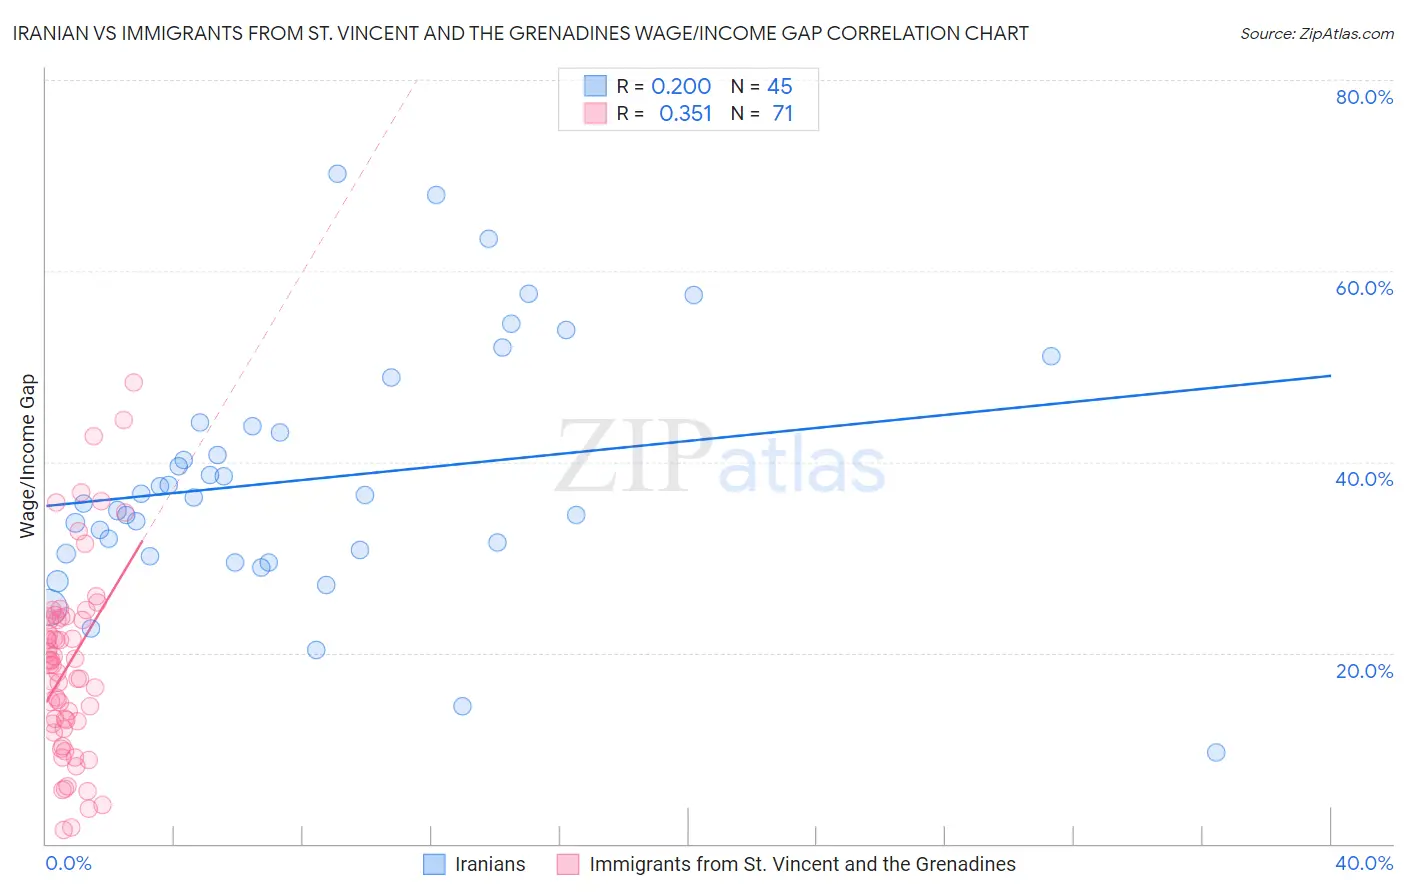
Iranian vs Immigrants from St. Vincent and the Grenadines Wage/Income Gap Correlation Chart
The statistical analysis conducted on geographies consisting of 316,773,224 people shows a weak positive correlation between the proportion of Iranians and wage/income gap percentage in the United States with a correlation coefficient (R) of 0.200 and weighted average of 29.7%. Similarly, the statistical analysis conducted on geographies consisting of 56,186,231 people shows a mild positive correlation between the proportion of Immigrants from St. Vincent and the Grenadines and wage/income gap percentage in the United States with a correlation coefficient (R) of 0.351 and weighted average of 16.4%, a difference of 81.0%.
Wage/Income Gap Correlation Summary
| Measurement | Iranian | Immigrants from St. Vincent and the Grenadines |
| Minimum | 9.6% | 1.4% |
| Maximum | 70.1% | 48.3% |
| Range | 60.5% | 46.9% |
| Mean | 38.2% | 18.8% |
| Median | 36.2% | 18.8% |
| Interquartile 25% (IQ1) | 30.2% | 12.5% |
| Interquartile 75% (IQ3) | 44.0% | 23.7% |
| Interquartile Range (IQR) | 13.8% | 11.2% |
| Standard Deviation (Sample) | 12.9% | 9.8% |
| Standard Deviation (Population) | 12.8% | 9.8% |
Similar Demographics by Wage/Income Gap
Demographics Similar to Iranians by Wage/Income Gap
In terms of wage/income gap, the demographic groups most similar to Iranians are Filipino (29.7%, a difference of 0.060%), Dutch (29.6%, a difference of 0.28%), Swiss (30.0%, a difference of 0.83%), English (29.5%, a difference of 0.86%), and Immigrants from Taiwan (29.5%, a difference of 0.87%).
| Demographics | Rating | Rank | Wage/Income Gap |
| Immigrants | South Central Asia | 0.0 /100 | #332 | Tragic 29.3% |
| Europeans | 0.0 /100 | #333 | Tragic 29.4% |
| Swedes | 0.0 /100 | #334 | Tragic 29.4% |
| Immigrants | Taiwan | 0.0 /100 | #335 | Tragic 29.5% |
| English | 0.0 /100 | #336 | Tragic 29.5% |
| Dutch | 0.0 /100 | #337 | Tragic 29.6% |
| Filipinos | 0.0 /100 | #338 | Tragic 29.7% |
| Iranians | 0.0 /100 | #339 | Tragic 29.7% |
| Swiss | 0.0 /100 | #340 | Tragic 30.0% |
| Thais | 0.0 /100 | #341 | Tragic 30.5% |
| Pennsylvania Germans | 0.0 /100 | #342 | Tragic 30.7% |
| Danes | 0.0 /100 | #343 | Tragic 31.0% |
| Assyrians/Chaldeans/Syriacs | 0.0 /100 | #344 | Tragic 31.0% |
| Immigrants | India | 0.0 /100 | #345 | Tragic 31.5% |
| Cajuns | 0.0 /100 | #346 | Tragic 33.9% |
Demographics Similar to Immigrants from St. Vincent and the Grenadines by Wage/Income Gap
In terms of wage/income gap, the demographic groups most similar to Immigrants from St. Vincent and the Grenadines are Immigrants from Grenada (16.2%, a difference of 1.5%), Immigrants from Barbados (17.8%, a difference of 8.6%), British West Indian (18.0%, a difference of 9.7%), Guyanese (18.3%, a difference of 11.5%), and Immigrants from Guyana (18.4%, a difference of 11.8%).
| Demographics | Rating | Rank | Wage/Income Gap |
| Immigrants | Grenada | 100.0 /100 | #1 | Exceptional 16.2% |
| Immigrants | St. Vincent and the Grenadines | 100.0 /100 | #2 | Exceptional 16.4% |
| Immigrants | Barbados | 100.0 /100 | #3 | Exceptional 17.8% |
| British West Indians | 100.0 /100 | #4 | Exceptional 18.0% |
| Guyanese | 100.0 /100 | #5 | Exceptional 18.3% |
| Immigrants | Guyana | 100.0 /100 | #6 | Exceptional 18.4% |
| Puerto Ricans | 100.0 /100 | #7 | Exceptional 18.7% |
| Immigrants | Jamaica | 100.0 /100 | #8 | Exceptional 18.8% |
| Barbadians | 100.0 /100 | #9 | Exceptional 19.0% |
| Crow | 100.0 /100 | #10 | Exceptional 19.1% |
| Immigrants | Haiti | 100.0 /100 | #11 | Exceptional 19.2% |
| Immigrants | West Indies | 100.0 /100 | #12 | Exceptional 19.2% |
| Trinidadians and Tobagonians | 100.0 /100 | #13 | Exceptional 19.3% |
| Immigrants | Trinidad and Tobago | 100.0 /100 | #14 | Exceptional 19.3% |
| West Indians | 100.0 /100 | #15 | Exceptional 19.6% |