Immigrants from Mexico vs Chickasaw Master's Degree
COMPARE
Immigrants from Mexico
Chickasaw
Master's Degree
Master's Degree Comparison
Immigrants from Mexico
Chickasaw
9.3%
MASTER'S DEGREE
0.0/ 100
METRIC RATING
342nd/ 347
METRIC RANK
11.4%
MASTER'S DEGREE
0.1/ 100
METRIC RATING
299th/ 347
METRIC RANK
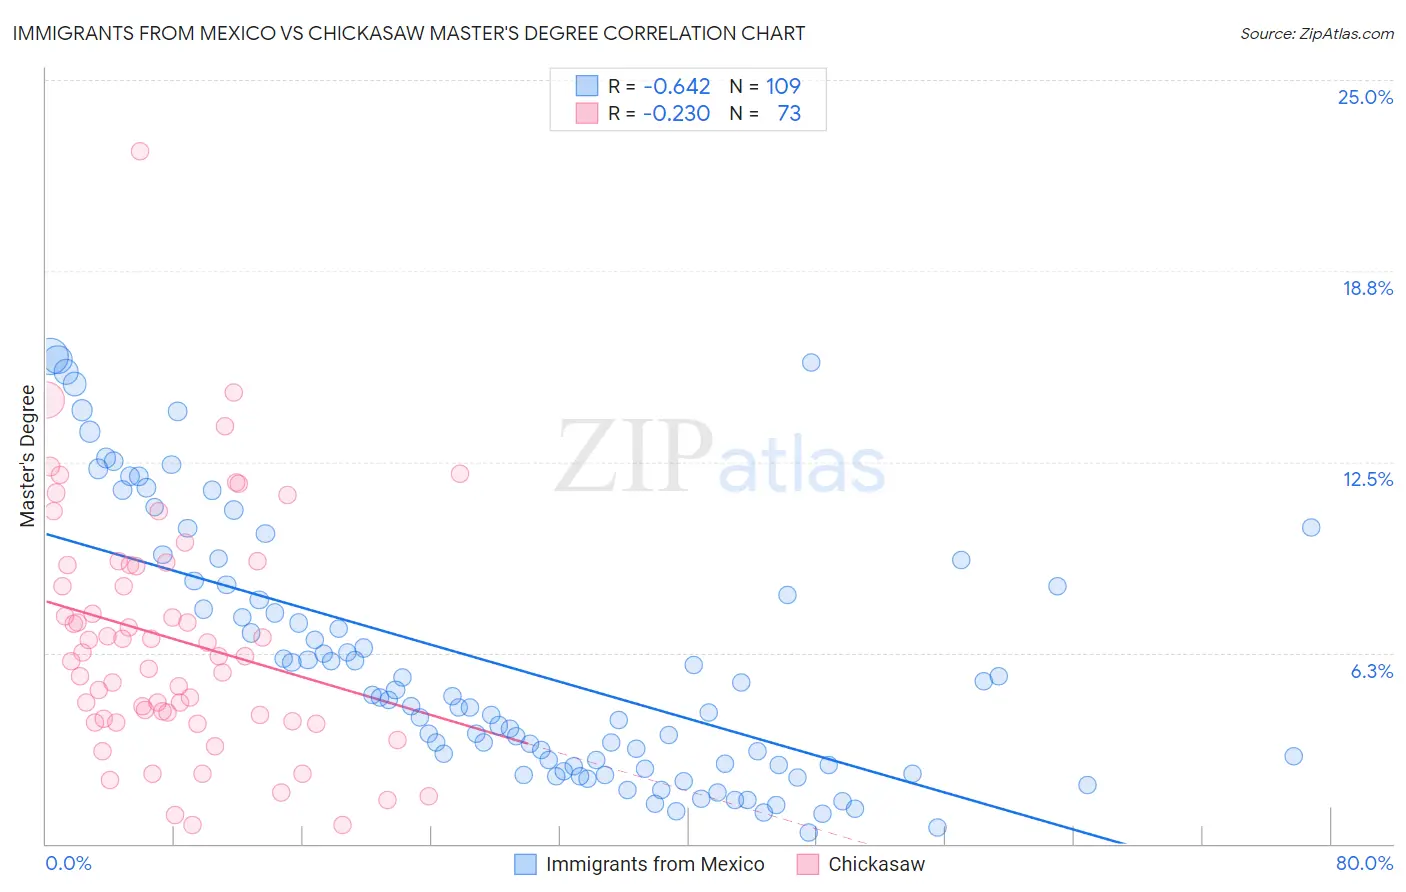
Immigrants from Mexico vs Chickasaw Master's Degree Correlation Chart
The statistical analysis conducted on geographies consisting of 513,107,790 people shows a significant negative correlation between the proportion of Immigrants from Mexico and percentage of population with at least master's degree education in the United States with a correlation coefficient (R) of -0.642 and weighted average of 9.3%. Similarly, the statistical analysis conducted on geographies consisting of 147,685,526 people shows a weak negative correlation between the proportion of Chickasaw and percentage of population with at least master's degree education in the United States with a correlation coefficient (R) of -0.230 and weighted average of 11.4%, a difference of 22.7%.
Master's Degree Correlation Summary
| Measurement | Immigrants from Mexico | Chickasaw |
| Minimum | 0.36% | 0.60% |
| Maximum | 16.0% | 22.7% |
| Range | 15.6% | 22.1% |
| Mean | 5.9% | 6.7% |
| Median | 4.7% | 6.1% |
| Interquartile 25% (IQ1) | 2.6% | 4.1% |
| Interquartile 75% (IQ3) | 8.5% | 9.1% |
| Interquartile Range (IQR) | 5.9% | 5.1% |
| Standard Deviation (Sample) | 4.2% | 3.9% |
| Standard Deviation (Population) | 4.1% | 3.9% |
Similar Demographics by Master's Degree
Demographics Similar to Immigrants from Mexico by Master's Degree
In terms of master's degree, the demographic groups most similar to Immigrants from Mexico are Lumbee (9.3%, a difference of 0.48%), Pima (9.2%, a difference of 0.65%), Yuman (9.2%, a difference of 0.81%), Navajo (9.4%, a difference of 1.3%), and Yakama (9.5%, a difference of 1.6%).
| Demographics | Rating | Rank | Master's Degree |
| Menominee | 0.0 /100 | #333 | Tragic 10.2% |
| Arapaho | 0.0 /100 | #334 | Tragic 10.0% |
| Immigrants | Central America | 0.0 /100 | #335 | Tragic 10.0% |
| Natives/Alaskans | 0.0 /100 | #336 | Tragic 9.9% |
| Mexicans | 0.0 /100 | #337 | Tragic 9.7% |
| Tohono O'odham | 0.0 /100 | #338 | Tragic 9.7% |
| Spanish American Indians | 0.0 /100 | #339 | Tragic 9.6% |
| Yakama | 0.0 /100 | #340 | Tragic 9.5% |
| Navajo | 0.0 /100 | #341 | Tragic 9.4% |
| Immigrants | Mexico | 0.0 /100 | #342 | Tragic 9.3% |
| Lumbee | 0.0 /100 | #343 | Tragic 9.3% |
| Pima | 0.0 /100 | #344 | Tragic 9.2% |
| Yuman | 0.0 /100 | #345 | Tragic 9.2% |
| Yup'ik | 0.0 /100 | #346 | Tragic 8.5% |
| Houma | 0.0 /100 | #347 | Tragic 7.9% |
Demographics Similar to Chickasaw by Master's Degree
In terms of master's degree, the demographic groups most similar to Chickasaw are Chippewa (11.4%, a difference of 0.020%), Tsimshian (11.4%, a difference of 0.18%), Samoan (11.5%, a difference of 0.46%), Cherokee (11.4%, a difference of 0.49%), and Immigrants from Laos (11.4%, a difference of 0.51%).
| Demographics | Rating | Rank | Master's Degree |
| Immigrants | Guatemala | 0.1 /100 | #292 | Tragic 11.6% |
| Alaska Natives | 0.1 /100 | #293 | Tragic 11.6% |
| Hawaiians | 0.1 /100 | #294 | Tragic 11.6% |
| Marshallese | 0.1 /100 | #295 | Tragic 11.6% |
| Alaskan Athabascans | 0.1 /100 | #296 | Tragic 11.6% |
| Immigrants | Yemen | 0.1 /100 | #297 | Tragic 11.6% |
| Samoans | 0.1 /100 | #298 | Tragic 11.5% |
| Chickasaw | 0.1 /100 | #299 | Tragic 11.4% |
| Chippewa | 0.1 /100 | #300 | Tragic 11.4% |
| Tsimshian | 0.1 /100 | #301 | Tragic 11.4% |
| Cherokee | 0.1 /100 | #302 | Tragic 11.4% |
| Immigrants | Laos | 0.1 /100 | #303 | Tragic 11.4% |
| Immigrants | Cabo Verde | 0.1 /100 | #304 | Tragic 11.3% |
| Immigrants | Latin America | 0.0 /100 | #305 | Tragic 11.3% |
| Mexican American Indians | 0.0 /100 | #306 | Tragic 11.2% |