Immigrants from Mexico vs Immigrants from Eritrea Per Capita Income
COMPARE
Immigrants from Mexico
Immigrants from Eritrea
Per Capita Income
Per Capita Income Comparison
Immigrants from Mexico
Immigrants from Eritrea
$33,931
PER CAPITA INCOME
0.0/ 100
METRIC RATING
331st/ 347
METRIC RANK
$44,509
PER CAPITA INCOME
72.1/ 100
METRIC RATING
150th/ 347
METRIC RANK
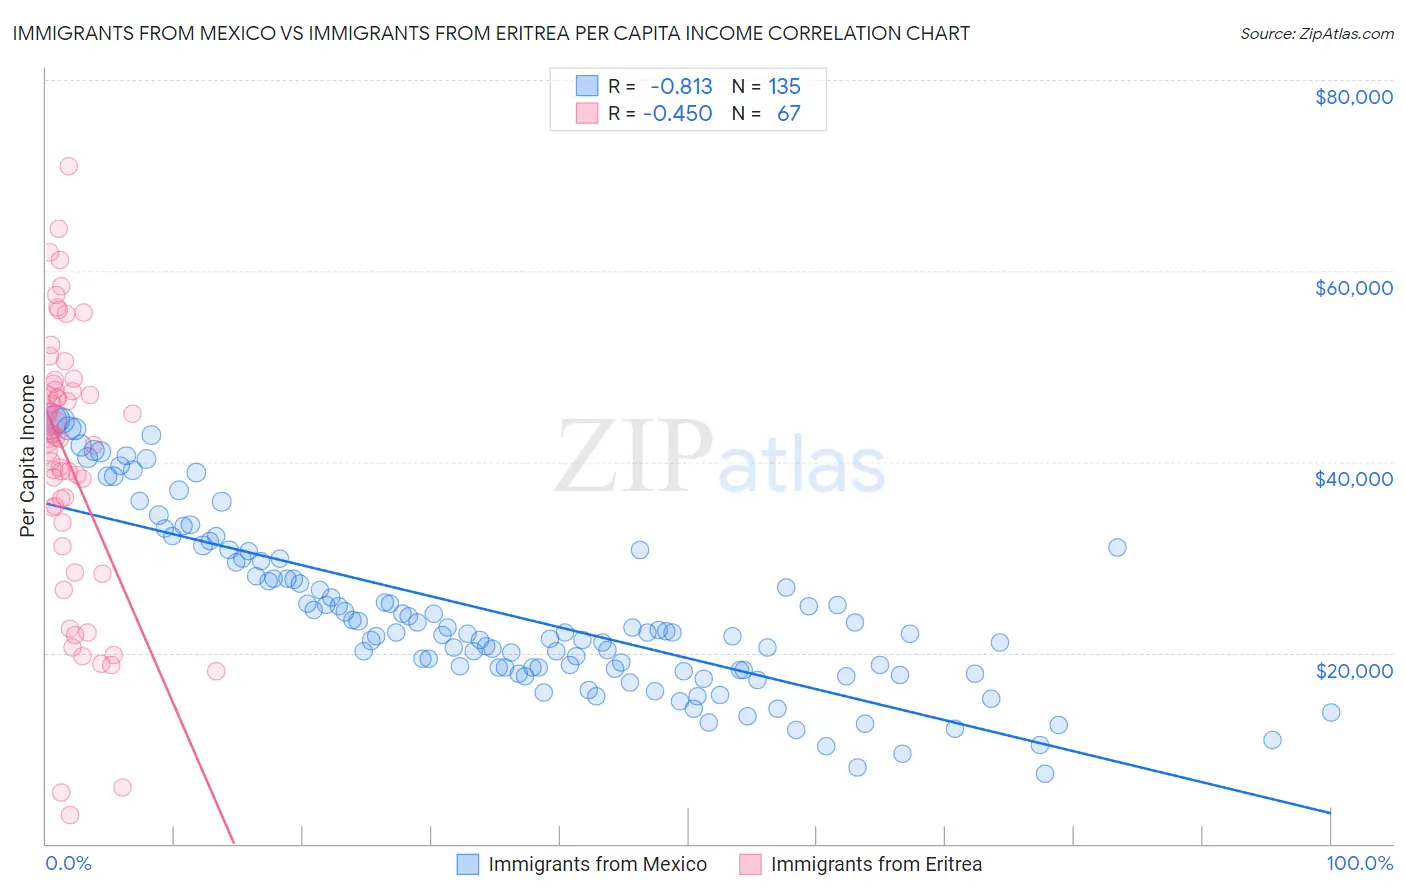
Immigrants from Mexico vs Immigrants from Eritrea Per Capita Income Correlation Chart
The statistical analysis conducted on geographies consisting of 513,776,249 people shows a very strong negative correlation between the proportion of Immigrants from Mexico and per capita income in the United States with a correlation coefficient (R) of -0.813 and weighted average of $33,931. Similarly, the statistical analysis conducted on geographies consisting of 104,855,166 people shows a moderate negative correlation between the proportion of Immigrants from Eritrea and per capita income in the United States with a correlation coefficient (R) of -0.450 and weighted average of $44,509, a difference of 31.2%.
Per Capita Income Correlation Summary
| Measurement | Immigrants from Mexico | Immigrants from Eritrea |
| Minimum | $7,365 | $3,067 |
| Maximum | $44,424 | $70,972 |
| Range | $37,059 | $67,905 |
| Mean | $24,192 | $39,964 |
| Median | $22,163 | $42,389 |
| Interquartile 25% (IQ1) | $18,195 | $33,601 |
| Interquartile 75% (IQ3) | $29,815 | $47,507 |
| Interquartile Range (IQR) | $11,620 | $13,906 |
| Standard Deviation (Sample) | $8,892 | $14,141 |
| Standard Deviation (Population) | $8,859 | $14,035 |
Similar Demographics by Per Capita Income
Demographics Similar to Immigrants from Mexico by Per Capita Income
In terms of per capita income, the demographic groups most similar to Immigrants from Mexico are Sioux ($33,921, a difference of 0.030%), Immigrants from Yemen ($33,696, a difference of 0.70%), Spanish American Indian ($34,195, a difference of 0.78%), Mexican ($34,559, a difference of 1.8%), and Menominee ($34,578, a difference of 1.9%).
| Demographics | Rating | Rank | Per Capita Income |
| Kiowa | 0.0 /100 | #324 | Tragic $35,102 |
| Immigrants | Central America | 0.0 /100 | #325 | Tragic $34,974 |
| Immigrants | Cuba | 0.0 /100 | #326 | Tragic $34,910 |
| Apache | 0.0 /100 | #327 | Tragic $34,886 |
| Menominee | 0.0 /100 | #328 | Tragic $34,578 |
| Mexicans | 0.0 /100 | #329 | Tragic $34,559 |
| Spanish American Indians | 0.0 /100 | #330 | Tragic $34,195 |
| Immigrants | Mexico | 0.0 /100 | #331 | Tragic $33,931 |
| Sioux | 0.0 /100 | #332 | Tragic $33,921 |
| Immigrants | Yemen | 0.0 /100 | #333 | Tragic $33,696 |
| Natives/Alaskans | 0.0 /100 | #334 | Tragic $33,279 |
| Yuman | 0.0 /100 | #335 | Tragic $33,236 |
| Yakama | 0.0 /100 | #336 | Tragic $33,009 |
| Houma | 0.0 /100 | #337 | Tragic $32,996 |
| Arapaho | 0.0 /100 | #338 | Tragic $32,345 |
Demographics Similar to Immigrants from Eritrea by Per Capita Income
In terms of per capita income, the demographic groups most similar to Immigrants from Eritrea are Korean ($44,522, a difference of 0.030%), Norwegian ($44,480, a difference of 0.060%), Peruvian ($44,479, a difference of 0.070%), Immigrants from Armenia ($44,552, a difference of 0.10%), and Scottish ($44,440, a difference of 0.16%).
| Demographics | Rating | Rank | Per Capita Income |
| Immigrants | Uganda | 82.5 /100 | #143 | Excellent $45,043 |
| Icelanders | 81.6 /100 | #144 | Excellent $44,987 |
| Immigrants | Afghanistan | 78.0 /100 | #145 | Good $44,790 |
| Irish | 75.8 /100 | #146 | Good $44,679 |
| Czechs | 74.1 /100 | #147 | Good $44,595 |
| Immigrants | Armenia | 73.1 /100 | #148 | Good $44,552 |
| Koreans | 72.5 /100 | #149 | Good $44,522 |
| Immigrants | Eritrea | 72.1 /100 | #150 | Good $44,509 |
| Norwegians | 71.5 /100 | #151 | Good $44,480 |
| Peruvians | 71.5 /100 | #152 | Good $44,479 |
| Scottish | 70.6 /100 | #153 | Good $44,440 |
| Portuguese | 68.7 /100 | #154 | Good $44,362 |
| Uruguayans | 67.6 /100 | #155 | Good $44,318 |
| Slovaks | 65.4 /100 | #156 | Good $44,229 |
| South American Indians | 64.8 /100 | #157 | Good $44,206 |