Immigrants from Mexico vs Chickasaw Householder Income Ages 45 - 64 years
COMPARE
Immigrants from Mexico
Chickasaw
Householder Income Ages 45 - 64 years
Householder Income Ages 45 - 64 years Comparison
Immigrants from Mexico
Chickasaw
$84,910
HOUSEHOLDER INCOME AGES 45 - 64 YEARS
0.0/ 100
METRIC RATING
299th/ 347
METRIC RANK
$82,193
HOUSEHOLDER INCOME AGES 45 - 64 YEARS
0.0/ 100
METRIC RATING
319th/ 347
METRIC RANK
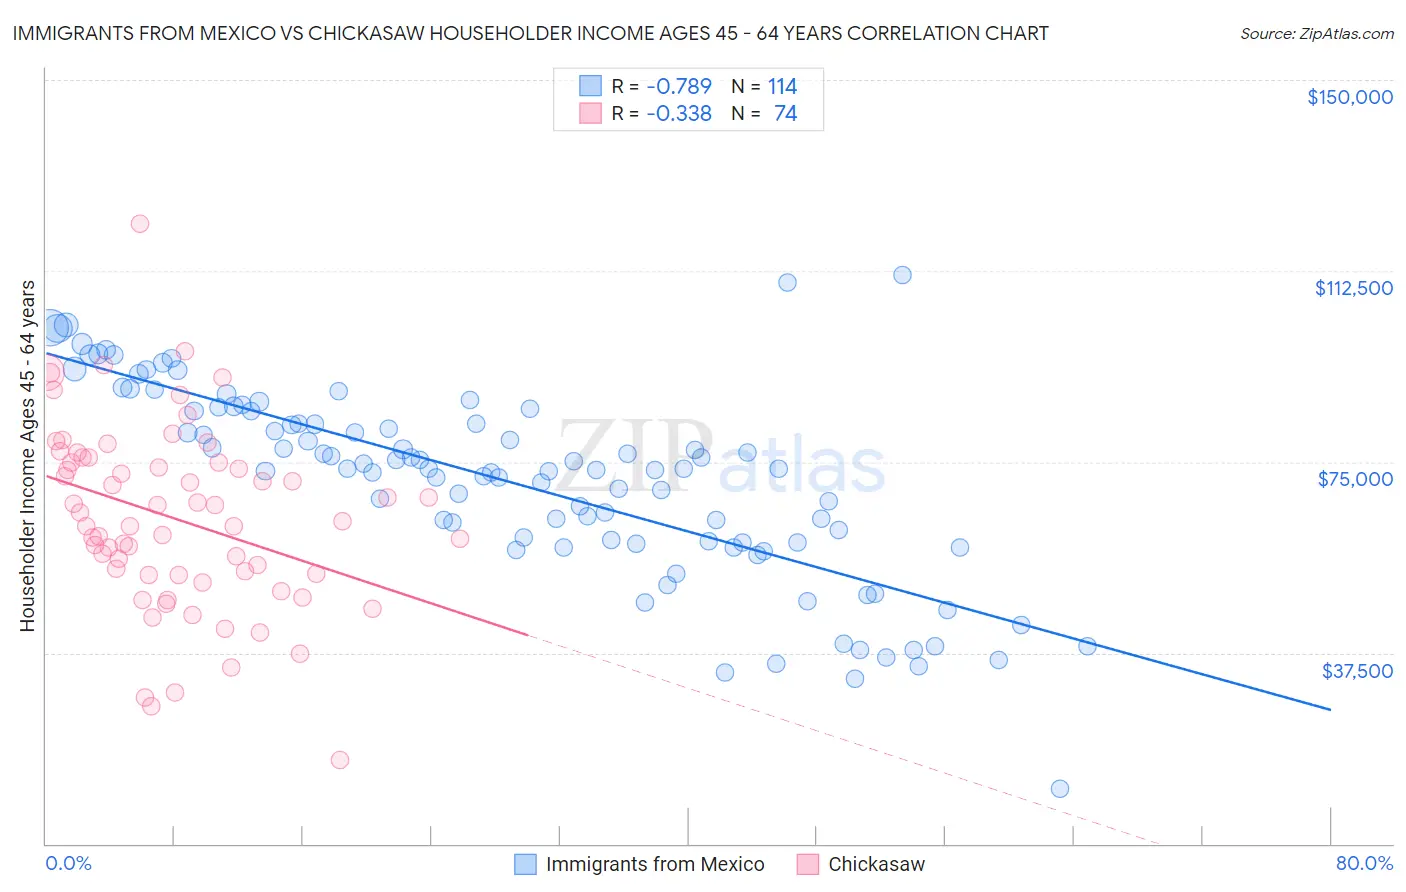
Immigrants from Mexico vs Chickasaw Householder Income Ages 45 - 64 years Correlation Chart
The statistical analysis conducted on geographies consisting of 511,517,023 people shows a strong negative correlation between the proportion of Immigrants from Mexico and household income with householder between the ages 45 and 64 in the United States with a correlation coefficient (R) of -0.789 and weighted average of $84,910. Similarly, the statistical analysis conducted on geographies consisting of 147,555,811 people shows a mild negative correlation between the proportion of Chickasaw and household income with householder between the ages 45 and 64 in the United States with a correlation coefficient (R) of -0.338 and weighted average of $82,193, a difference of 3.3%.
Householder Income Ages 45 - 64 years Correlation Summary
| Measurement | Immigrants from Mexico | Chickasaw |
| Minimum | $10,788 | $16,544 |
| Maximum | $111,667 | $121,667 |
| Range | $100,879 | $105,123 |
| Mean | $71,096 | $63,806 |
| Median | $73,588 | $62,897 |
| Interquartile 25% (IQ1) | $59,284 | $52,874 |
| Interquartile 75% (IQ3) | $85,004 | $75,000 |
| Interquartile Range (IQR) | $25,720 | $22,126 |
| Standard Deviation (Sample) | $18,984 | $18,170 |
| Standard Deviation (Population) | $18,900 | $18,046 |
Demographics Similar to Immigrants from Mexico and Chickasaw by Householder Income Ages 45 - 64 years
In terms of householder income ages 45 - 64 years, the demographic groups most similar to Immigrants from Mexico are Indonesian ($84,890, a difference of 0.020%), Potawatomi ($84,613, a difference of 0.35%), Haitian ($84,384, a difference of 0.62%), Honduran ($84,079, a difference of 0.99%), and Ottawa ($83,953, a difference of 1.1%). Similarly, the demographic groups most similar to Chickasaw are Choctaw ($82,287, a difference of 0.11%), Colville ($82,474, a difference of 0.34%), Immigrants from Caribbean ($82,513, a difference of 0.39%), Paiute ($82,629, a difference of 0.53%), and Immigrants from Honduras ($82,697, a difference of 0.61%).
| Demographics | Rating | Rank | Householder Income Ages 45 - 64 years |
| Immigrants | Mexico | 0.0 /100 | #299 | Tragic $84,910 |
| Indonesians | 0.0 /100 | #300 | Tragic $84,890 |
| Potawatomi | 0.0 /100 | #301 | Tragic $84,613 |
| Haitians | 0.0 /100 | #302 | Tragic $84,384 |
| Hondurans | 0.0 /100 | #303 | Tragic $84,079 |
| Ottawa | 0.0 /100 | #304 | Tragic $83,953 |
| Chippewa | 0.0 /100 | #305 | Tragic $83,943 |
| Ute | 0.0 /100 | #306 | Tragic $83,937 |
| Shoshone | 0.0 /100 | #307 | Tragic $83,588 |
| Immigrants | Cabo Verde | 0.0 /100 | #308 | Tragic $83,542 |
| Immigrants | Dominica | 0.0 /100 | #309 | Tragic $83,311 |
| Immigrants | Haiti | 0.0 /100 | #310 | Tragic $83,257 |
| Immigrants | Bahamas | 0.0 /100 | #311 | Tragic $83,177 |
| Cajuns | 0.0 /100 | #312 | Tragic $83,015 |
| U.S. Virgin Islanders | 0.0 /100 | #313 | Tragic $82,736 |
| Immigrants | Honduras | 0.0 /100 | #314 | Tragic $82,697 |
| Paiute | 0.0 /100 | #315 | Tragic $82,629 |
| Immigrants | Caribbean | 0.0 /100 | #316 | Tragic $82,513 |
| Colville | 0.0 /100 | #317 | Tragic $82,474 |
| Choctaw | 0.0 /100 | #318 | Tragic $82,287 |
| Chickasaw | 0.0 /100 | #319 | Tragic $82,193 |