Immigrants from Indonesia vs Malaysian Wage/Income Gap
COMPARE
Immigrants from Indonesia
Malaysian
Wage/Income Gap
Wage/Income Gap Comparison
Immigrants from Indonesia
Malaysians
26.1%
WAGE/INCOME GAP
32.5/ 100
METRIC RATING
186th/ 347
METRIC RANK
25.0%
WAGE/INCOME GAP
84.9/ 100
METRIC RATING
147th/ 347
METRIC RANK
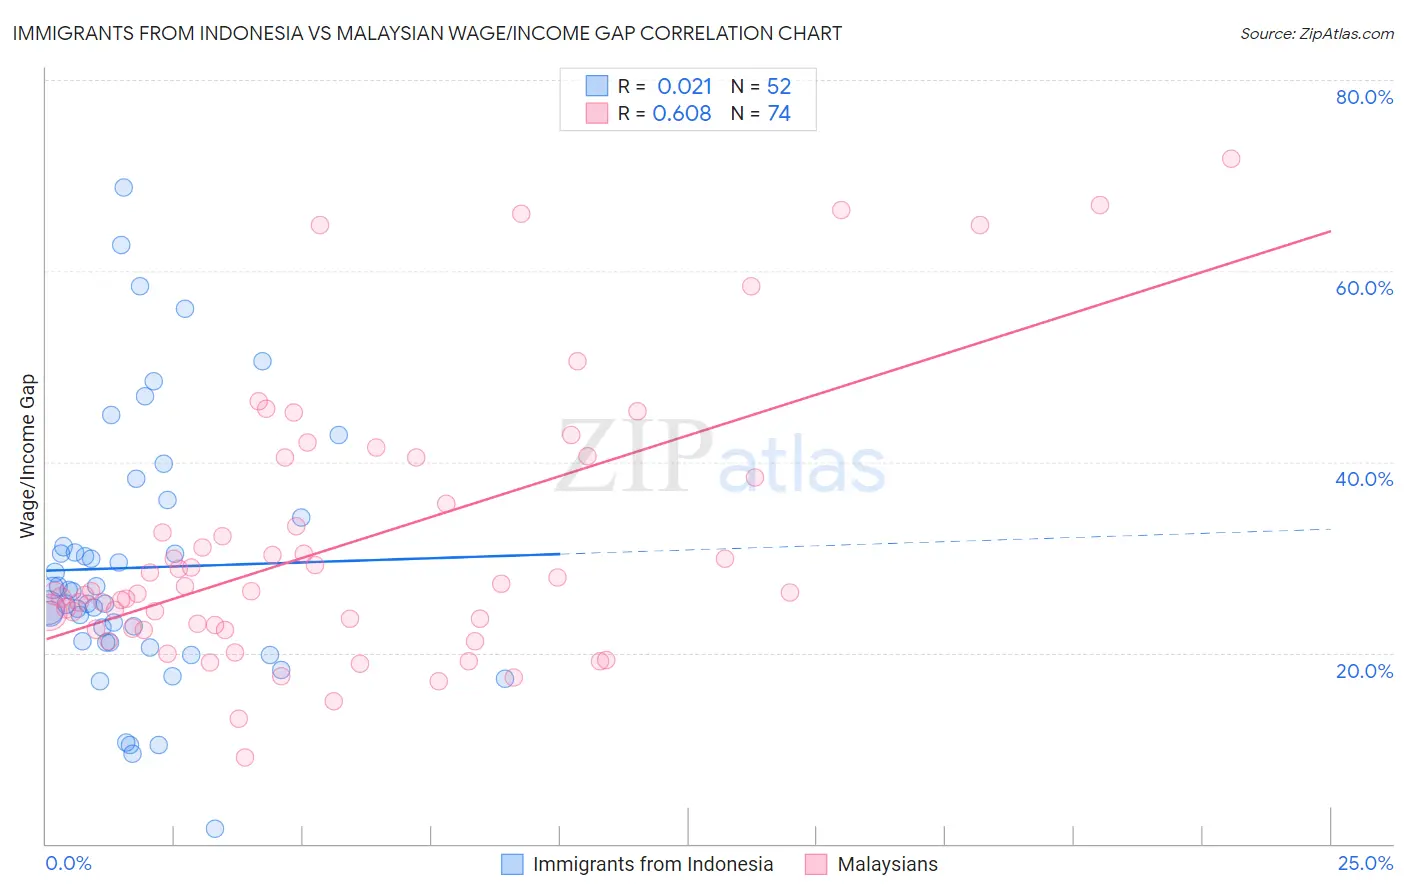
Immigrants from Indonesia vs Malaysian Wage/Income Gap Correlation Chart
The statistical analysis conducted on geographies consisting of 215,739,542 people shows no correlation between the proportion of Immigrants from Indonesia and wage/income gap percentage in the United States with a correlation coefficient (R) of 0.021 and weighted average of 26.1%. Similarly, the statistical analysis conducted on geographies consisting of 226,066,613 people shows a significant positive correlation between the proportion of Malaysians and wage/income gap percentage in the United States with a correlation coefficient (R) of 0.608 and weighted average of 25.0%, a difference of 4.1%.
Wage/Income Gap Correlation Summary
| Measurement | Immigrants from Indonesia | Malaysian |
| Minimum | 1.6% | 9.0% |
| Maximum | 68.7% | 71.7% |
| Range | 67.1% | 62.7% |
| Mean | 28.9% | 31.3% |
| Median | 25.8% | 26.4% |
| Interquartile 25% (IQ1) | 21.1% | 22.6% |
| Interquartile 75% (IQ3) | 32.6% | 38.4% |
| Interquartile Range (IQR) | 11.6% | 15.8% |
| Standard Deviation (Sample) | 13.7% | 14.0% |
| Standard Deviation (Population) | 13.6% | 13.9% |
Similar Demographics by Wage/Income Gap
Demographics Similar to Immigrants from Indonesia by Wage/Income Gap
In terms of wage/income gap, the demographic groups most similar to Immigrants from Indonesia are Pakistani (26.1%, a difference of 0.080%), Mexican (26.0%, a difference of 0.13%), Immigrants from Kazakhstan (26.0%, a difference of 0.19%), Palestinian (26.1%, a difference of 0.19%), and Immigrants from Serbia (26.0%, a difference of 0.20%).
| Demographics | Rating | Rank | Wage/Income Gap |
| Samoans | 38.6 /100 | #179 | Fair 26.0% |
| Guamanians/Chamorros | 38.0 /100 | #180 | Fair 26.0% |
| Immigrants | Bolivia | 36.4 /100 | #181 | Fair 26.0% |
| Immigrants | Serbia | 35.4 /100 | #182 | Fair 26.0% |
| Immigrants | Kazakhstan | 35.2 /100 | #183 | Fair 26.0% |
| Mexicans | 34.4 /100 | #184 | Fair 26.0% |
| Pakistanis | 33.7 /100 | #185 | Fair 26.1% |
| Immigrants | Indonesia | 32.5 /100 | #186 | Fair 26.1% |
| Palestinians | 29.9 /100 | #187 | Fair 26.1% |
| Immigrants | Egypt | 29.9 /100 | #188 | Fair 26.1% |
| Immigrants | Moldova | 26.6 /100 | #189 | Fair 26.2% |
| Immigrants | Croatia | 24.8 /100 | #190 | Fair 26.2% |
| Immigrants | Venezuela | 24.7 /100 | #191 | Fair 26.2% |
| Immigrants | Bulgaria | 22.5 /100 | #192 | Fair 26.3% |
| Immigrants | Jordan | 22.4 /100 | #193 | Fair 26.3% |
Demographics Similar to Malaysians by Wage/Income Gap
In terms of wage/income gap, the demographic groups most similar to Malaysians are Comanche (25.0%, a difference of 0.030%), South American (25.0%, a difference of 0.030%), Iroquois (25.1%, a difference of 0.14%), Chippewa (25.0%, a difference of 0.27%), and Immigrants from Peru (25.1%, a difference of 0.28%).
| Demographics | Rating | Rank | Wage/Income Gap |
| Immigrants | Nepal | 89.3 /100 | #140 | Excellent 24.9% |
| Hawaiians | 89.3 /100 | #141 | Excellent 24.9% |
| Afghans | 88.1 /100 | #142 | Excellent 24.9% |
| Immigrants | Uganda | 88.0 /100 | #143 | Excellent 24.9% |
| Chippewa | 86.9 /100 | #144 | Excellent 25.0% |
| Comanche | 85.2 /100 | #145 | Excellent 25.0% |
| South Americans | 85.2 /100 | #146 | Excellent 25.0% |
| Malaysians | 84.9 /100 | #147 | Excellent 25.0% |
| Iroquois | 83.9 /100 | #148 | Excellent 25.1% |
| Immigrants | Peru | 82.6 /100 | #149 | Excellent 25.1% |
| Immigrants | Immigrants | 82.3 /100 | #150 | Excellent 25.1% |
| Taiwanese | 81.6 /100 | #151 | Excellent 25.1% |
| Uruguayans | 81.3 /100 | #152 | Excellent 25.2% |
| Blackfeet | 78.1 /100 | #153 | Good 25.2% |
| Immigrants | Northern Africa | 78.1 /100 | #154 | Good 25.2% |