Immigrants from Indonesia vs Macedonian Wage/Income Gap
COMPARE
Immigrants from Indonesia
Macedonian
Wage/Income Gap
Wage/Income Gap Comparison
Immigrants from Indonesia
Macedonians
26.1%
WAGE/INCOME GAP
32.5/ 100
METRIC RATING
186th/ 347
METRIC RANK
28.6%
WAGE/INCOME GAP
0.1/ 100
METRIC RATING
309th/ 347
METRIC RANK
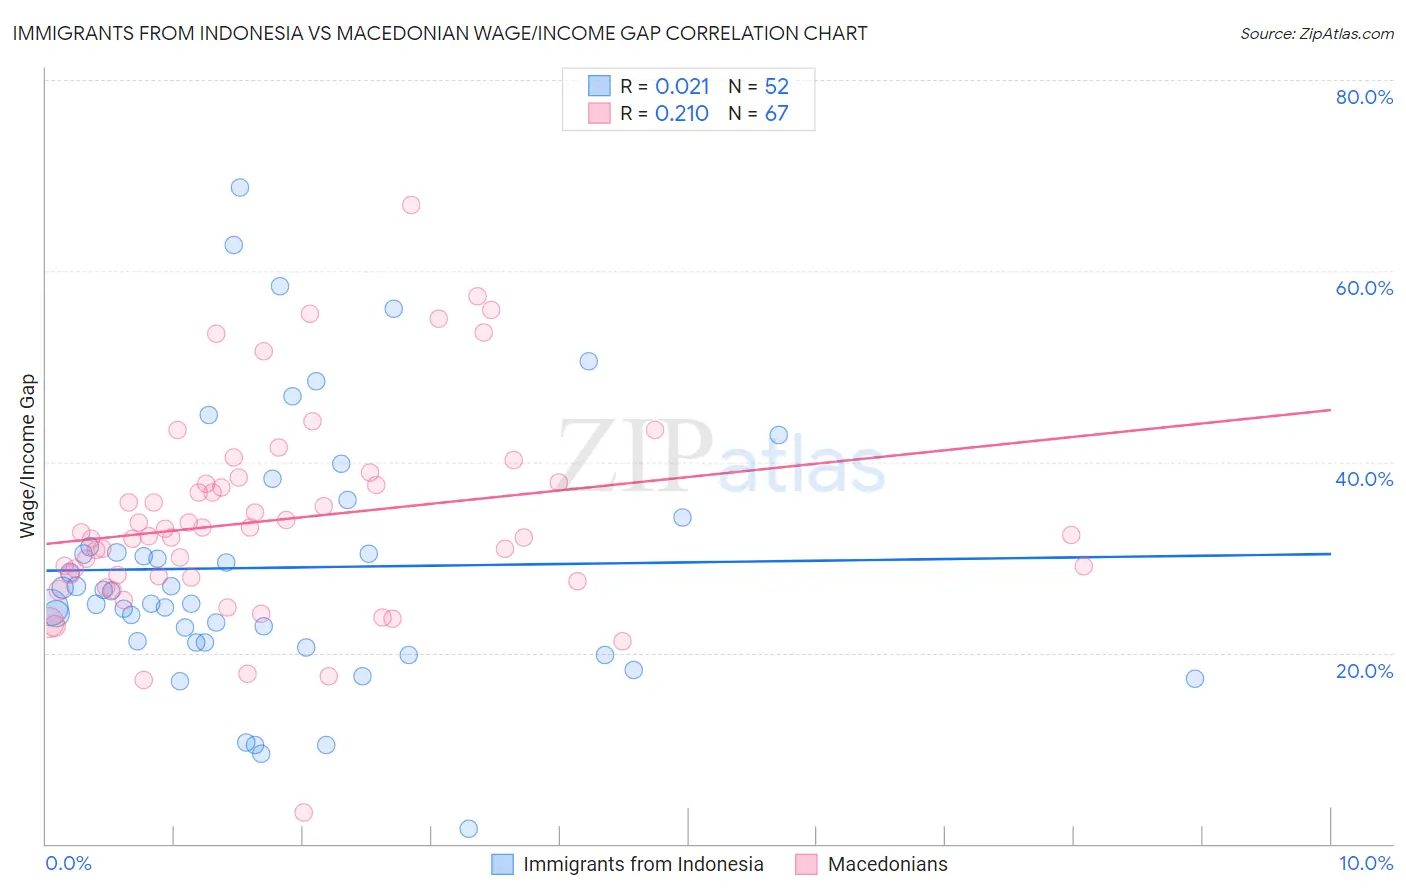
Immigrants from Indonesia vs Macedonian Wage/Income Gap Correlation Chart
The statistical analysis conducted on geographies consisting of 215,739,542 people shows no correlation between the proportion of Immigrants from Indonesia and wage/income gap percentage in the United States with a correlation coefficient (R) of 0.021 and weighted average of 26.1%. Similarly, the statistical analysis conducted on geographies consisting of 132,645,129 people shows a weak positive correlation between the proportion of Macedonians and wage/income gap percentage in the United States with a correlation coefficient (R) of 0.210 and weighted average of 28.6%, a difference of 9.5%.
Wage/Income Gap Correlation Summary
| Measurement | Immigrants from Indonesia | Macedonian |
| Minimum | 1.6% | 3.2% |
| Maximum | 68.7% | 67.0% |
| Range | 67.1% | 63.7% |
| Mean | 28.9% | 33.9% |
| Median | 25.8% | 32.4% |
| Interquartile 25% (IQ1) | 21.1% | 27.9% |
| Interquartile 75% (IQ3) | 32.6% | 37.9% |
| Interquartile Range (IQR) | 11.6% | 10.0% |
| Standard Deviation (Sample) | 13.7% | 10.8% |
| Standard Deviation (Population) | 13.6% | 10.8% |
Similar Demographics by Wage/Income Gap
Demographics Similar to Immigrants from Indonesia by Wage/Income Gap
In terms of wage/income gap, the demographic groups most similar to Immigrants from Indonesia are Pakistani (26.1%, a difference of 0.080%), Mexican (26.0%, a difference of 0.13%), Immigrants from Kazakhstan (26.0%, a difference of 0.19%), Palestinian (26.1%, a difference of 0.19%), and Immigrants from Serbia (26.0%, a difference of 0.20%).
| Demographics | Rating | Rank | Wage/Income Gap |
| Samoans | 38.6 /100 | #179 | Fair 26.0% |
| Guamanians/Chamorros | 38.0 /100 | #180 | Fair 26.0% |
| Immigrants | Bolivia | 36.4 /100 | #181 | Fair 26.0% |
| Immigrants | Serbia | 35.4 /100 | #182 | Fair 26.0% |
| Immigrants | Kazakhstan | 35.2 /100 | #183 | Fair 26.0% |
| Mexicans | 34.4 /100 | #184 | Fair 26.0% |
| Pakistanis | 33.7 /100 | #185 | Fair 26.1% |
| Immigrants | Indonesia | 32.5 /100 | #186 | Fair 26.1% |
| Palestinians | 29.9 /100 | #187 | Fair 26.1% |
| Immigrants | Egypt | 29.9 /100 | #188 | Fair 26.1% |
| Immigrants | Moldova | 26.6 /100 | #189 | Fair 26.2% |
| Immigrants | Croatia | 24.8 /100 | #190 | Fair 26.2% |
| Immigrants | Venezuela | 24.7 /100 | #191 | Fair 26.2% |
| Immigrants | Bulgaria | 22.5 /100 | #192 | Fair 26.3% |
| Immigrants | Jordan | 22.4 /100 | #193 | Fair 26.3% |
Demographics Similar to Macedonians by Wage/Income Gap
In terms of wage/income gap, the demographic groups most similar to Macedonians are Polish (28.5%, a difference of 0.090%), Finnish (28.6%, a difference of 0.090%), Immigrants from Denmark (28.5%, a difference of 0.16%), Immigrants from Lithuania (28.6%, a difference of 0.16%), and White/Caucasian (28.5%, a difference of 0.17%).
| Demographics | Rating | Rank | Wage/Income Gap |
| Scotch-Irish | 0.2 /100 | #302 | Tragic 28.5% |
| Irish | 0.2 /100 | #303 | Tragic 28.5% |
| Immigrants | Netherlands | 0.2 /100 | #304 | Tragic 28.5% |
| Immigrants | South Africa | 0.1 /100 | #305 | Tragic 28.5% |
| Whites/Caucasians | 0.1 /100 | #306 | Tragic 28.5% |
| Immigrants | Denmark | 0.1 /100 | #307 | Tragic 28.5% |
| Poles | 0.1 /100 | #308 | Tragic 28.5% |
| Macedonians | 0.1 /100 | #309 | Tragic 28.6% |
| Finns | 0.1 /100 | #310 | Tragic 28.6% |
| Immigrants | Lithuania | 0.1 /100 | #311 | Tragic 28.6% |
| Eastern Europeans | 0.1 /100 | #312 | Tragic 28.6% |
| French | 0.1 /100 | #313 | Tragic 28.7% |
| Immigrants | Scotland | 0.1 /100 | #314 | Tragic 28.7% |
| Maltese | 0.1 /100 | #315 | Tragic 28.7% |
| Lithuanians | 0.1 /100 | #316 | Tragic 28.7% |