German Russian vs Malaysian Wage/Income Gap
COMPARE
German Russian
Malaysian
Wage/Income Gap
Wage/Income Gap Comparison
German Russians
Malaysians
24.6%
WAGE/INCOME GAP
93.7/ 100
METRIC RATING
127th/ 347
METRIC RANK
25.0%
WAGE/INCOME GAP
84.9/ 100
METRIC RATING
147th/ 347
METRIC RANK
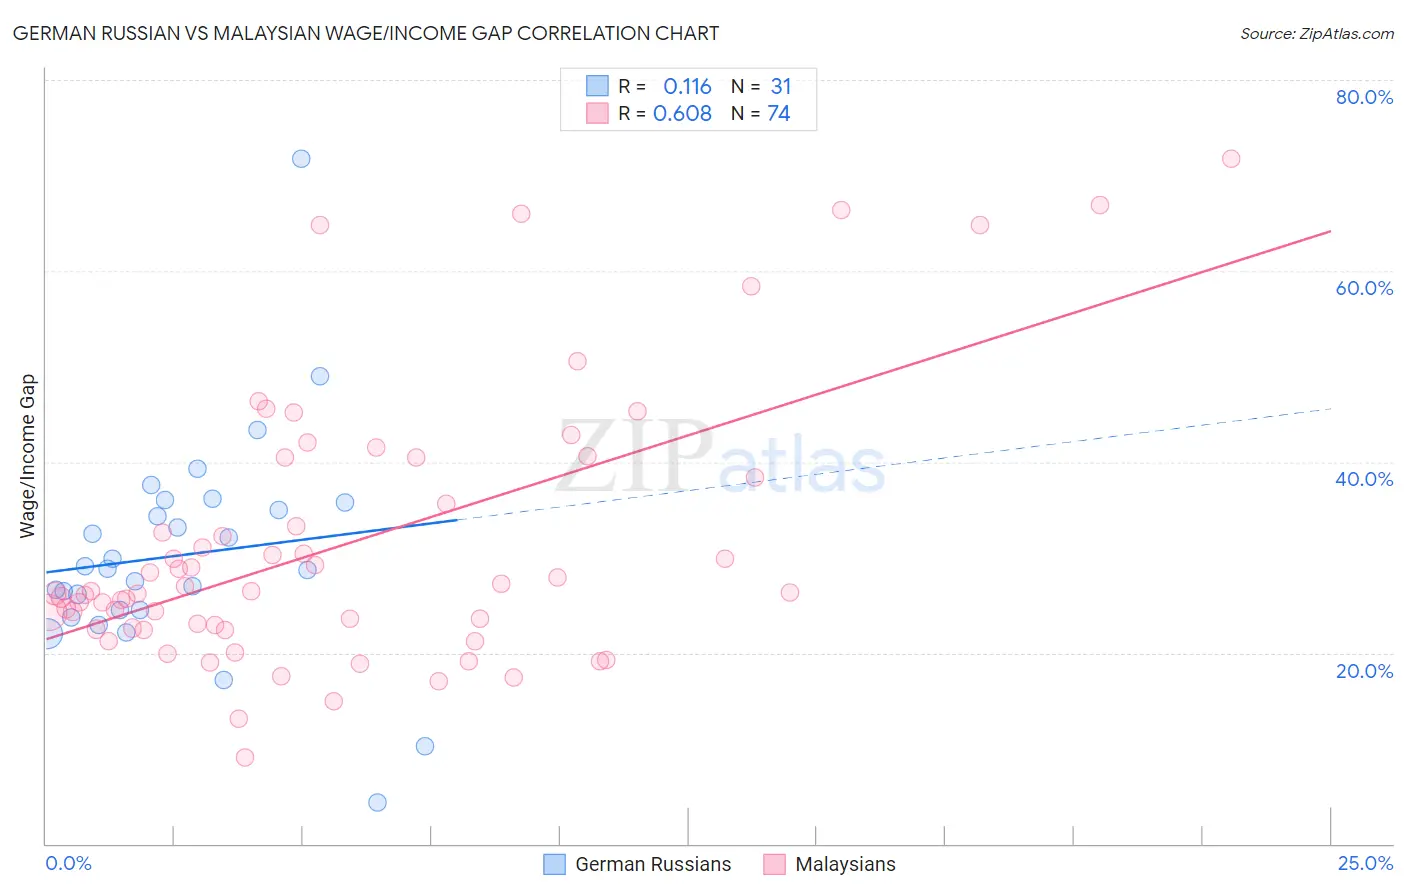
German Russian vs Malaysian Wage/Income Gap Correlation Chart
The statistical analysis conducted on geographies consisting of 96,446,629 people shows a poor positive correlation between the proportion of German Russians and wage/income gap percentage in the United States with a correlation coefficient (R) of 0.116 and weighted average of 24.6%. Similarly, the statistical analysis conducted on geographies consisting of 226,066,613 people shows a significant positive correlation between the proportion of Malaysians and wage/income gap percentage in the United States with a correlation coefficient (R) of 0.608 and weighted average of 25.0%, a difference of 1.7%.
Wage/Income Gap Correlation Summary
| Measurement | German Russian | Malaysian |
| Minimum | 4.3% | 9.0% |
| Maximum | 71.8% | 71.7% |
| Range | 67.5% | 62.7% |
| Mean | 30.2% | 31.3% |
| Median | 28.8% | 26.4% |
| Interquartile 25% (IQ1) | 24.4% | 22.6% |
| Interquartile 75% (IQ3) | 35.8% | 38.4% |
| Interquartile Range (IQR) | 11.3% | 15.8% |
| Standard Deviation (Sample) | 11.8% | 14.0% |
| Standard Deviation (Population) | 11.6% | 13.9% |
Demographics Similar to German Russians and Malaysians by Wage/Income Gap
In terms of wage/income gap, the demographic groups most similar to German Russians are Immigrants from Central America (24.6%, a difference of 0.070%), Yup'ik (24.7%, a difference of 0.12%), Alsatian (24.7%, a difference of 0.14%), Immigrants from Philippines (24.7%, a difference of 0.21%), and Immigrants from Costa Rica (24.7%, a difference of 0.36%). Similarly, the demographic groups most similar to Malaysians are Comanche (25.0%, a difference of 0.030%), South American (25.0%, a difference of 0.030%), Chippewa (25.0%, a difference of 0.27%), Immigrants from Uganda (24.9%, a difference of 0.44%), and Afghan (24.9%, a difference of 0.46%).
| Demographics | Rating | Rank | Wage/Income Gap |
| German Russians | 93.7 /100 | #127 | Exceptional 24.6% |
| Immigrants | Central America | 93.5 /100 | #128 | Exceptional 24.6% |
| Yup'ik | 93.3 /100 | #129 | Exceptional 24.7% |
| Alsatians | 93.2 /100 | #130 | Exceptional 24.7% |
| Immigrants | Philippines | 93.0 /100 | #131 | Exceptional 24.7% |
| Immigrants | Costa Rica | 92.4 /100 | #132 | Exceptional 24.7% |
| Colombians | 92.4 /100 | #133 | Exceptional 24.7% |
| Mexican American Indians | 92.2 /100 | #134 | Exceptional 24.7% |
| South American Indians | 92.0 /100 | #135 | Exceptional 24.7% |
| Armenians | 91.3 /100 | #136 | Exceptional 24.8% |
| Immigrants | South Eastern Asia | 90.9 /100 | #137 | Exceptional 24.8% |
| Immigrants | Bosnia and Herzegovina | 90.1 /100 | #138 | Exceptional 24.8% |
| Hispanics or Latinos | 89.5 /100 | #139 | Excellent 24.9% |
| Immigrants | Nepal | 89.3 /100 | #140 | Excellent 24.9% |
| Hawaiians | 89.3 /100 | #141 | Excellent 24.9% |
| Afghans | 88.1 /100 | #142 | Excellent 24.9% |
| Immigrants | Uganda | 88.0 /100 | #143 | Excellent 24.9% |
| Chippewa | 86.9 /100 | #144 | Excellent 25.0% |
| Comanche | 85.2 /100 | #145 | Excellent 25.0% |
| South Americans | 85.2 /100 | #146 | Excellent 25.0% |
| Malaysians | 84.9 /100 | #147 | Excellent 25.0% |