Immigrants from Indonesia vs Immigrants from Belize Wage/Income Gap
COMPARE
Immigrants from Indonesia
Immigrants from Belize
Wage/Income Gap
Wage/Income Gap Comparison
Immigrants from Indonesia
Immigrants from Belize
26.1%
WAGE/INCOME GAP
32.5/ 100
METRIC RATING
186th/ 347
METRIC RANK
21.3%
WAGE/INCOME GAP
100.0/ 100
METRIC RATING
38th/ 347
METRIC RANK
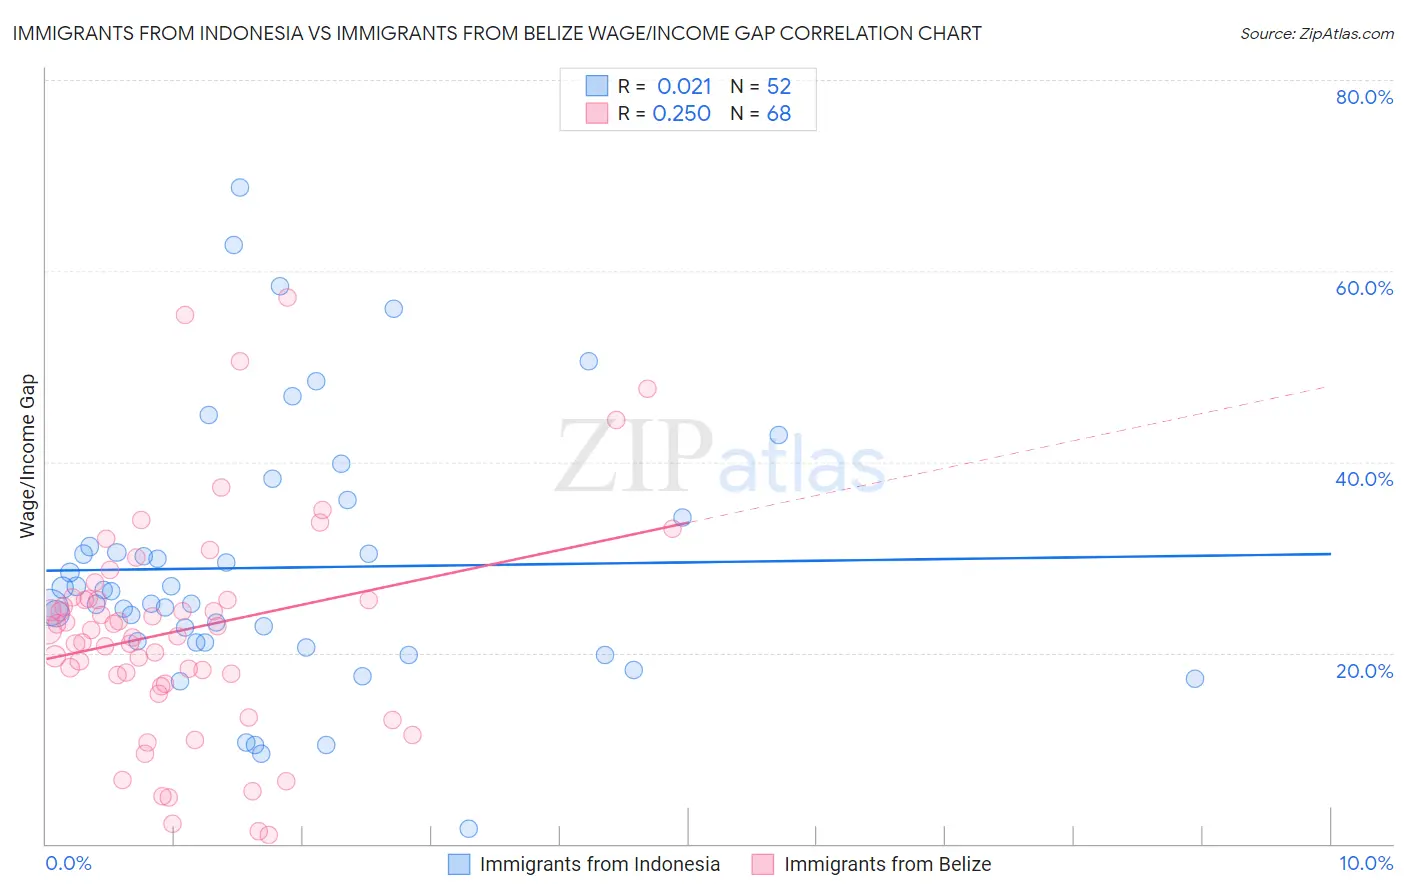
Immigrants from Indonesia vs Immigrants from Belize Wage/Income Gap Correlation Chart
The statistical analysis conducted on geographies consisting of 215,739,542 people shows no correlation between the proportion of Immigrants from Indonesia and wage/income gap percentage in the United States with a correlation coefficient (R) of 0.021 and weighted average of 26.1%. Similarly, the statistical analysis conducted on geographies consisting of 130,310,260 people shows a weak positive correlation between the proportion of Immigrants from Belize and wage/income gap percentage in the United States with a correlation coefficient (R) of 0.250 and weighted average of 21.3%, a difference of 22.7%.
Wage/Income Gap Correlation Summary
| Measurement | Immigrants from Indonesia | Immigrants from Belize |
| Minimum | 1.6% | 0.94% |
| Maximum | 68.7% | 57.2% |
| Range | 67.1% | 56.2% |
| Mean | 28.9% | 22.4% |
| Median | 25.8% | 22.4% |
| Interquartile 25% (IQ1) | 21.1% | 17.3% |
| Interquartile 75% (IQ3) | 32.6% | 25.7% |
| Interquartile Range (IQR) | 11.6% | 8.4% |
| Standard Deviation (Sample) | 13.7% | 11.6% |
| Standard Deviation (Population) | 13.6% | 11.5% |
Similar Demographics by Wage/Income Gap
Demographics Similar to Immigrants from Indonesia by Wage/Income Gap
In terms of wage/income gap, the demographic groups most similar to Immigrants from Indonesia are Pakistani (26.1%, a difference of 0.080%), Mexican (26.0%, a difference of 0.13%), Immigrants from Kazakhstan (26.0%, a difference of 0.19%), Palestinian (26.1%, a difference of 0.19%), and Immigrants from Serbia (26.0%, a difference of 0.20%).
| Demographics | Rating | Rank | Wage/Income Gap |
| Samoans | 38.6 /100 | #179 | Fair 26.0% |
| Guamanians/Chamorros | 38.0 /100 | #180 | Fair 26.0% |
| Immigrants | Bolivia | 36.4 /100 | #181 | Fair 26.0% |
| Immigrants | Serbia | 35.4 /100 | #182 | Fair 26.0% |
| Immigrants | Kazakhstan | 35.2 /100 | #183 | Fair 26.0% |
| Mexicans | 34.4 /100 | #184 | Fair 26.0% |
| Pakistanis | 33.7 /100 | #185 | Fair 26.1% |
| Immigrants | Indonesia | 32.5 /100 | #186 | Fair 26.1% |
| Palestinians | 29.9 /100 | #187 | Fair 26.1% |
| Immigrants | Egypt | 29.9 /100 | #188 | Fair 26.1% |
| Immigrants | Moldova | 26.6 /100 | #189 | Fair 26.2% |
| Immigrants | Croatia | 24.8 /100 | #190 | Fair 26.2% |
| Immigrants | Venezuela | 24.7 /100 | #191 | Fair 26.2% |
| Immigrants | Bulgaria | 22.5 /100 | #192 | Fair 26.3% |
| Immigrants | Jordan | 22.4 /100 | #193 | Fair 26.3% |
Demographics Similar to Immigrants from Belize by Wage/Income Gap
In terms of wage/income gap, the demographic groups most similar to Immigrants from Belize are Immigrants from Somalia (21.2%, a difference of 0.050%), Colville (21.3%, a difference of 0.11%), Belizean (21.2%, a difference of 0.12%), Somali (21.2%, a difference of 0.14%), and Lumbee (21.3%, a difference of 0.31%).
| Demographics | Rating | Rank | Wage/Income Gap |
| Vietnamese | 100.0 /100 | #31 | Exceptional 21.0% |
| Immigrants | Yemen | 100.0 /100 | #32 | Exceptional 21.1% |
| Immigrants | Bahamas | 100.0 /100 | #33 | Exceptional 21.1% |
| Pima | 100.0 /100 | #34 | Exceptional 21.1% |
| Somalis | 100.0 /100 | #35 | Exceptional 21.2% |
| Belizeans | 100.0 /100 | #36 | Exceptional 21.2% |
| Immigrants | Somalia | 100.0 /100 | #37 | Exceptional 21.2% |
| Immigrants | Belize | 100.0 /100 | #38 | Exceptional 21.3% |
| Colville | 100.0 /100 | #39 | Exceptional 21.3% |
| Lumbee | 100.0 /100 | #40 | Exceptional 21.3% |
| Liberians | 100.0 /100 | #41 | Exceptional 21.4% |
| Immigrants | Sierra Leone | 100.0 /100 | #42 | Exceptional 21.4% |
| Sierra Leoneans | 100.0 /100 | #43 | Exceptional 21.4% |
| Immigrants | Eritrea | 100.0 /100 | #44 | Exceptional 21.4% |
| U.S. Virgin Islanders | 100.0 /100 | #45 | Exceptional 21.5% |