Immigrants from Indonesia vs Malaysian Disability Age 35 to 64
COMPARE
Immigrants from Indonesia
Malaysian
Disability Age 35 to 64
Disability Age 35 to 64 Comparison
Immigrants from Indonesia
Malaysians
9.7%
DISABILITY AGE 35 TO 64
99.9/ 100
METRIC RATING
33rd/ 347
METRIC RANK
12.5%
DISABILITY AGE 35 TO 64
0.5/ 100
METRIC RATING
261st/ 347
METRIC RANK
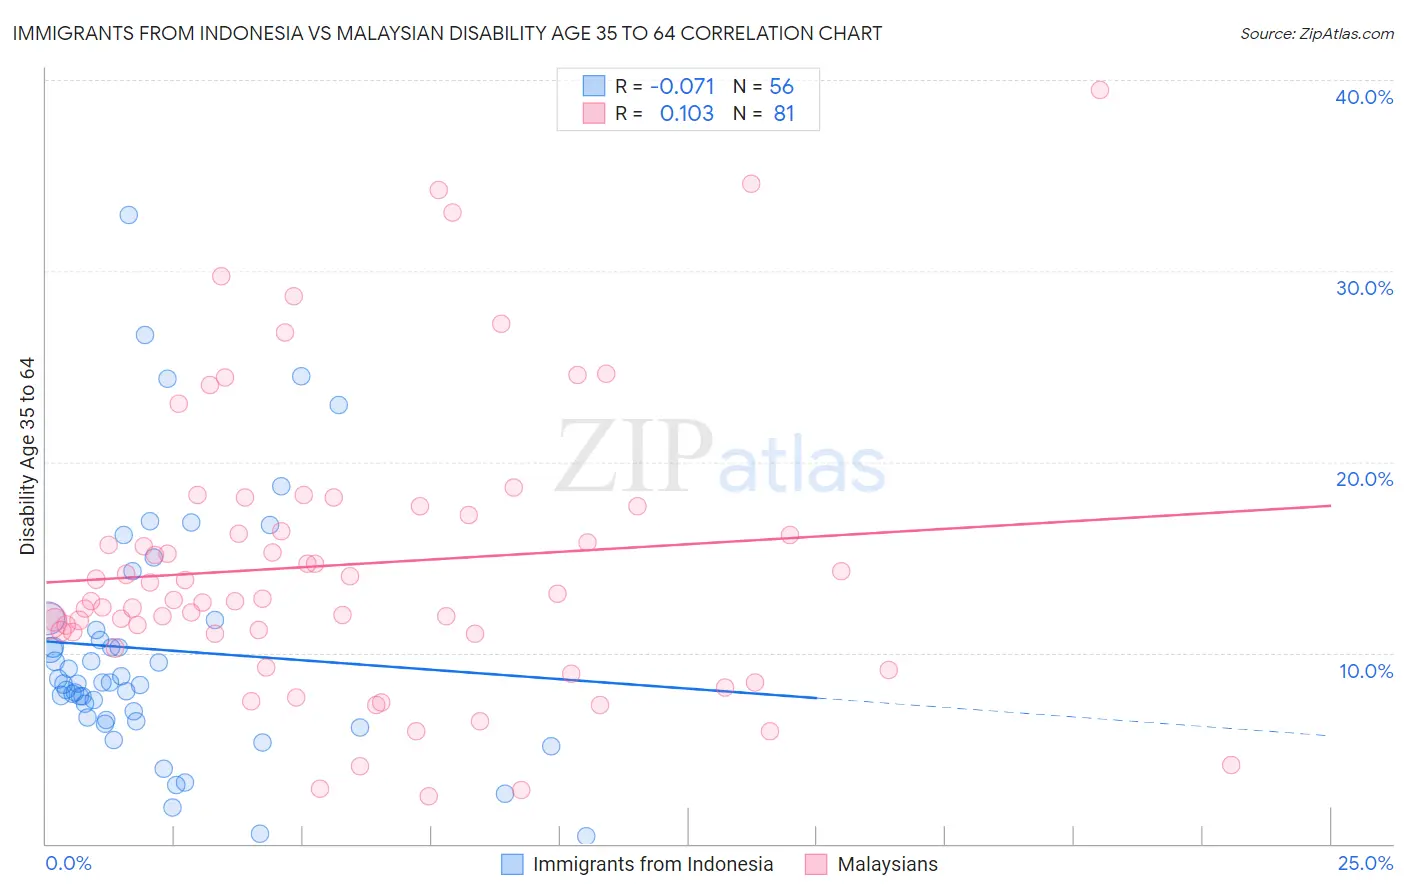
Immigrants from Indonesia vs Malaysian Disability Age 35 to 64 Correlation Chart
The statistical analysis conducted on geographies consisting of 215,721,507 people shows a slight negative correlation between the proportion of Immigrants from Indonesia and percentage of population with a disability between the ages 34 and 64 in the United States with a correlation coefficient (R) of -0.071 and weighted average of 9.7%. Similarly, the statistical analysis conducted on geographies consisting of 225,999,925 people shows a poor positive correlation between the proportion of Malaysians and percentage of population with a disability between the ages 34 and 64 in the United States with a correlation coefficient (R) of 0.103 and weighted average of 12.5%, a difference of 29.2%.
Disability Age 35 to 64 Correlation Summary
| Measurement | Immigrants from Indonesia | Malaysian |
| Minimum | 0.38% | 2.5% |
| Maximum | 32.9% | 39.5% |
| Range | 32.6% | 37.0% |
| Mean | 10.2% | 14.6% |
| Median | 8.4% | 12.8% |
| Interquartile 25% (IQ1) | 6.6% | 11.0% |
| Interquartile 75% (IQ3) | 11.4% | 17.4% |
| Interquartile Range (IQR) | 4.9% | 6.5% |
| Standard Deviation (Sample) | 6.5% | 7.5% |
| Standard Deviation (Population) | 6.4% | 7.5% |
Similar Demographics by Disability Age 35 to 64
Demographics Similar to Immigrants from Indonesia by Disability Age 35 to 64
In terms of disability age 35 to 64, the demographic groups most similar to Immigrants from Indonesia are Turkish (9.7%, a difference of 0.070%), Immigrants from Australia (9.7%, a difference of 0.070%), Bulgarian (9.7%, a difference of 0.17%), Immigrants from Cuba (9.7%, a difference of 0.21%), and Immigrants from Turkey (9.7%, a difference of 0.29%).
| Demographics | Rating | Rank | Disability Age 35 to 64 |
| Immigrants | Sri Lanka | 100.0 /100 | #26 | Exceptional 9.5% |
| Immigrants | Asia | 100.0 /100 | #27 | Exceptional 9.5% |
| Immigrants | Pakistan | 100.0 /100 | #28 | Exceptional 9.5% |
| Immigrants | Ireland | 100.0 /100 | #29 | Exceptional 9.5% |
| Immigrants | Japan | 100.0 /100 | #30 | Exceptional 9.5% |
| Immigrants | Lithuania | 99.9 /100 | #31 | Exceptional 9.6% |
| Turks | 99.9 /100 | #32 | Exceptional 9.7% |
| Immigrants | Indonesia | 99.9 /100 | #33 | Exceptional 9.7% |
| Immigrants | Australia | 99.9 /100 | #34 | Exceptional 9.7% |
| Bulgarians | 99.9 /100 | #35 | Exceptional 9.7% |
| Immigrants | Cuba | 99.9 /100 | #36 | Exceptional 9.7% |
| Immigrants | Turkey | 99.9 /100 | #37 | Exceptional 9.7% |
| Egyptians | 99.9 /100 | #38 | Exceptional 9.7% |
| Immigrants | Belarus | 99.9 /100 | #39 | Exceptional 9.7% |
| Immigrants | Armenia | 99.9 /100 | #40 | Exceptional 9.7% |
Demographics Similar to Malaysians by Disability Age 35 to 64
In terms of disability age 35 to 64, the demographic groups most similar to Malaysians are Senegalese (12.5%, a difference of 0.080%), German Russian (12.5%, a difference of 0.15%), Immigrants from Zaire (12.5%, a difference of 0.33%), Immigrants from Portugal (12.5%, a difference of 0.34%), and English (12.4%, a difference of 0.40%).
| Demographics | Rating | Rank | Disability Age 35 to 64 |
| Hawaiians | 0.9 /100 | #254 | Tragic 12.3% |
| Japanese | 0.8 /100 | #255 | Tragic 12.3% |
| Scottish | 0.8 /100 | #256 | Tragic 12.4% |
| Mexicans | 0.7 /100 | #257 | Tragic 12.4% |
| Welsh | 0.6 /100 | #258 | Tragic 12.4% |
| English | 0.6 /100 | #259 | Tragic 12.4% |
| German Russians | 0.5 /100 | #260 | Tragic 12.5% |
| Malaysians | 0.5 /100 | #261 | Tragic 12.5% |
| Senegalese | 0.5 /100 | #262 | Tragic 12.5% |
| Immigrants | Zaire | 0.4 /100 | #263 | Tragic 12.5% |
| Immigrants | Portugal | 0.4 /100 | #264 | Tragic 12.5% |
| Marshallese | 0.4 /100 | #265 | Tragic 12.5% |
| Whites/Caucasians | 0.3 /100 | #266 | Tragic 12.6% |
| Sub-Saharan Africans | 0.2 /100 | #267 | Tragic 12.6% |
| Immigrants | Dominica | 0.2 /100 | #268 | Tragic 12.7% |