Immigrants from Greece vs Tlingit-Haida Wage/Income Gap
COMPARE
Immigrants from Greece
Tlingit-Haida
Wage/Income Gap
Wage/Income Gap Comparison
Immigrants from Greece
Tlingit-Haida
25.7%
WAGE/INCOME GAP
56.6/ 100
METRIC RATING
171st/ 347
METRIC RANK
24.0%
WAGE/INCOME GAP
98.7/ 100
METRIC RATING
104th/ 347
METRIC RANK
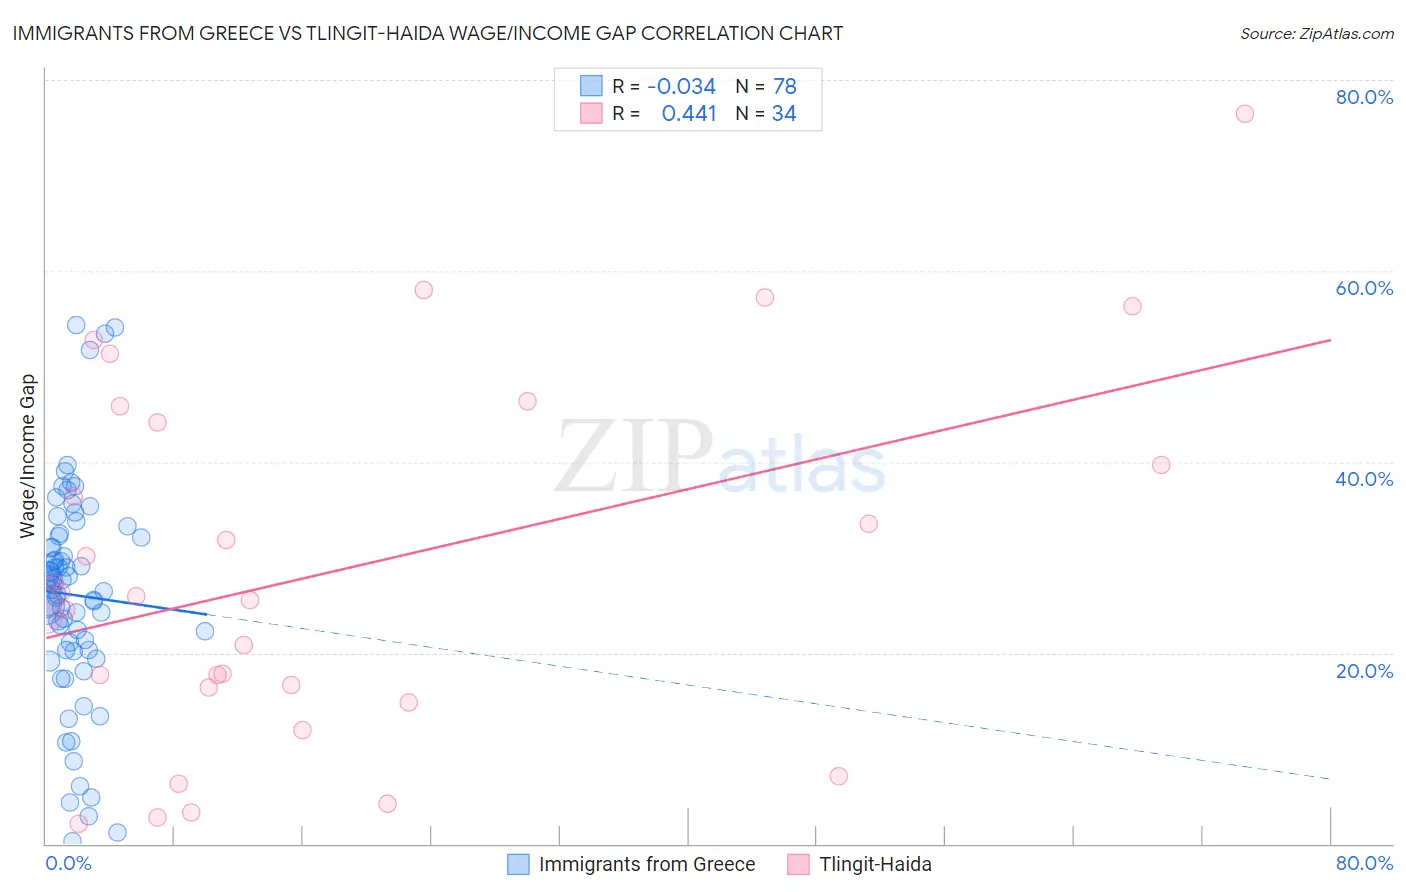
Immigrants from Greece vs Tlingit-Haida Wage/Income Gap Correlation Chart
The statistical analysis conducted on geographies consisting of 216,813,156 people shows no correlation between the proportion of Immigrants from Greece and wage/income gap percentage in the United States with a correlation coefficient (R) of -0.034 and weighted average of 25.7%. Similarly, the statistical analysis conducted on geographies consisting of 60,845,560 people shows a moderate positive correlation between the proportion of Tlingit-Haida and wage/income gap percentage in the United States with a correlation coefficient (R) of 0.441 and weighted average of 24.0%, a difference of 7.1%.
Wage/Income Gap Correlation Summary
| Measurement | Immigrants from Greece | Tlingit-Haida |
| Minimum | 0.24% | 2.1% |
| Maximum | 54.3% | 76.5% |
| Range | 54.0% | 74.4% |
| Mean | 26.1% | 28.6% |
| Median | 26.8% | 25.7% |
| Interquartile 25% (IQ1) | 20.3% | 16.3% |
| Interquartile 75% (IQ3) | 32.0% | 44.2% |
| Interquartile Range (IQR) | 11.7% | 27.9% |
| Standard Deviation (Sample) | 11.2% | 18.9% |
| Standard Deviation (Population) | 11.1% | 18.6% |
Similar Demographics by Wage/Income Gap
Demographics Similar to Immigrants from Greece by Wage/Income Gap
In terms of wage/income gap, the demographic groups most similar to Immigrants from Greece are Immigrants from Oceania (25.6%, a difference of 0.060%), Immigrants from Chile (25.7%, a difference of 0.22%), Peruvian (25.6%, a difference of 0.23%), Immigrants from Belarus (25.7%, a difference of 0.24%), and Seminole (25.6%, a difference of 0.41%).
| Demographics | Rating | Rank | Wage/Income Gap |
| Koreans | 68.6 /100 | #164 | Good 25.4% |
| Immigrants | Hong Kong | 64.0 /100 | #165 | Good 25.5% |
| Immigrants | Ukraine | 63.8 /100 | #166 | Good 25.5% |
| Paiute | 62.9 /100 | #167 | Good 25.5% |
| Seminole | 62.6 /100 | #168 | Good 25.6% |
| Peruvians | 60.1 /100 | #169 | Good 25.6% |
| Immigrants | Oceania | 57.5 /100 | #170 | Average 25.6% |
| Immigrants | Greece | 56.6 /100 | #171 | Average 25.7% |
| Immigrants | Chile | 53.2 /100 | #172 | Average 25.7% |
| Immigrants | Belarus | 52.9 /100 | #173 | Average 25.7% |
| Alaskan Athabascans | 50.0 /100 | #174 | Average 25.8% |
| Sri Lankans | 47.0 /100 | #175 | Average 25.8% |
| Paraguayans | 46.7 /100 | #176 | Average 25.8% |
| Cambodians | 45.1 /100 | #177 | Average 25.8% |
| Chinese | 42.0 /100 | #178 | Average 25.9% |
Demographics Similar to Tlingit-Haida by Wage/Income Gap
In terms of wage/income gap, the demographic groups most similar to Tlingit-Haida are Moroccan (24.0%, a difference of 0.060%), Sudanese (24.0%, a difference of 0.060%), Tsimshian (23.9%, a difference of 0.33%), Yaqui (24.0%, a difference of 0.36%), and Immigrants from Albania (24.0%, a difference of 0.37%).
| Demographics | Rating | Rank | Wage/Income Gap |
| Immigrants | Sudan | 99.4 /100 | #97 | Exceptional 23.6% |
| Immigrants | Latin America | 99.2 /100 | #98 | Exceptional 23.7% |
| Aleuts | 99.2 /100 | #99 | Exceptional 23.7% |
| Yakama | 99.2 /100 | #100 | Exceptional 23.7% |
| Japanese | 99.1 /100 | #101 | Exceptional 23.8% |
| Immigrants | Laos | 99.0 /100 | #102 | Exceptional 23.8% |
| Tsimshian | 98.9 /100 | #103 | Exceptional 23.9% |
| Tlingit-Haida | 98.7 /100 | #104 | Exceptional 24.0% |
| Moroccans | 98.6 /100 | #105 | Exceptional 24.0% |
| Sudanese | 98.6 /100 | #106 | Exceptional 24.0% |
| Yaqui | 98.4 /100 | #107 | Exceptional 24.0% |
| Immigrants | Albania | 98.4 /100 | #108 | Exceptional 24.0% |
| Ugandans | 98.3 /100 | #109 | Exceptional 24.1% |
| Immigrants | Morocco | 98.1 /100 | #110 | Exceptional 24.1% |
| Soviet Union | 97.6 /100 | #111 | Exceptional 24.2% |