Pakistani vs Tlingit-Haida Wage/Income Gap
COMPARE
Pakistani
Tlingit-Haida
Wage/Income Gap
Wage/Income Gap Comparison
Pakistanis
Tlingit-Haida
26.1%
WAGE/INCOME GAP
33.7/ 100
METRIC RATING
185th/ 347
METRIC RANK
24.0%
WAGE/INCOME GAP
98.7/ 100
METRIC RATING
104th/ 347
METRIC RANK
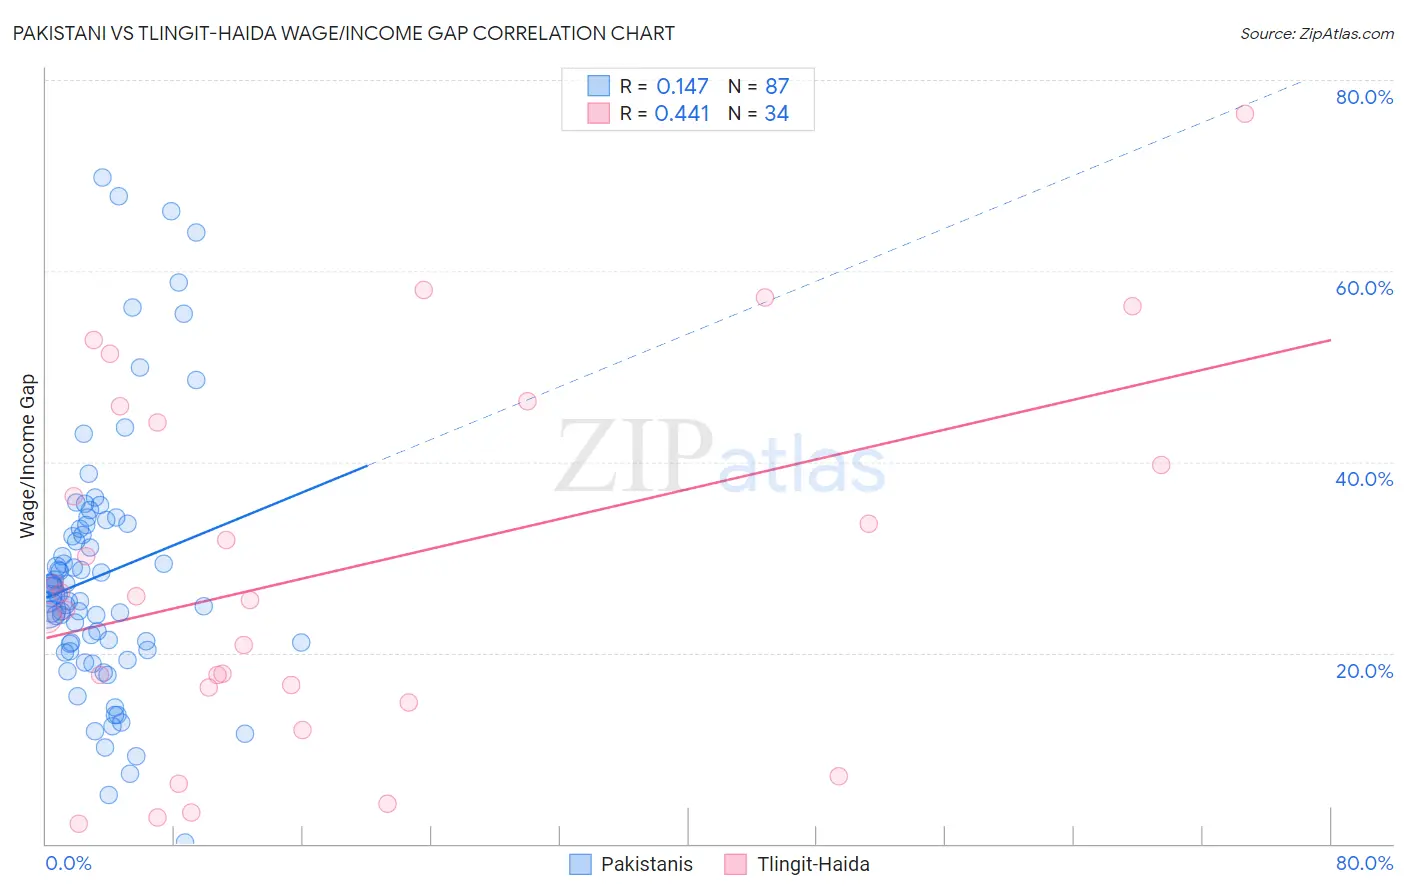
Pakistani vs Tlingit-Haida Wage/Income Gap Correlation Chart
The statistical analysis conducted on geographies consisting of 335,237,953 people shows a poor positive correlation between the proportion of Pakistanis and wage/income gap percentage in the United States with a correlation coefficient (R) of 0.147 and weighted average of 26.1%. Similarly, the statistical analysis conducted on geographies consisting of 60,845,560 people shows a moderate positive correlation between the proportion of Tlingit-Haida and wage/income gap percentage in the United States with a correlation coefficient (R) of 0.441 and weighted average of 24.0%, a difference of 8.8%.
Wage/Income Gap Correlation Summary
| Measurement | Pakistani | Tlingit-Haida |
| Minimum | 0.10% | 2.1% |
| Maximum | 69.7% | 76.5% |
| Range | 69.6% | 74.4% |
| Mean | 28.1% | 28.6% |
| Median | 26.1% | 25.7% |
| Interquartile 25% (IQ1) | 20.3% | 16.3% |
| Interquartile 75% (IQ3) | 33.4% | 44.2% |
| Interquartile Range (IQR) | 13.1% | 27.9% |
| Standard Deviation (Sample) | 13.6% | 18.9% |
| Standard Deviation (Population) | 13.6% | 18.6% |
Similar Demographics by Wage/Income Gap
Demographics Similar to Pakistanis by Wage/Income Gap
In terms of wage/income gap, the demographic groups most similar to Pakistanis are Mexican (26.0%, a difference of 0.050%), Immigrants from Indonesia (26.1%, a difference of 0.080%), Immigrants from Kazakhstan (26.0%, a difference of 0.11%), Immigrants from Serbia (26.0%, a difference of 0.12%), and Immigrants from Bolivia (26.0%, a difference of 0.19%).
| Demographics | Rating | Rank | Wage/Income Gap |
| Chinese | 42.0 /100 | #178 | Average 25.9% |
| Samoans | 38.6 /100 | #179 | Fair 26.0% |
| Guamanians/Chamorros | 38.0 /100 | #180 | Fair 26.0% |
| Immigrants | Bolivia | 36.4 /100 | #181 | Fair 26.0% |
| Immigrants | Serbia | 35.4 /100 | #182 | Fair 26.0% |
| Immigrants | Kazakhstan | 35.2 /100 | #183 | Fair 26.0% |
| Mexicans | 34.4 /100 | #184 | Fair 26.0% |
| Pakistanis | 33.7 /100 | #185 | Fair 26.1% |
| Immigrants | Indonesia | 32.5 /100 | #186 | Fair 26.1% |
| Palestinians | 29.9 /100 | #187 | Fair 26.1% |
| Immigrants | Egypt | 29.9 /100 | #188 | Fair 26.1% |
| Immigrants | Moldova | 26.6 /100 | #189 | Fair 26.2% |
| Immigrants | Croatia | 24.8 /100 | #190 | Fair 26.2% |
| Immigrants | Venezuela | 24.7 /100 | #191 | Fair 26.2% |
| Immigrants | Bulgaria | 22.5 /100 | #192 | Fair 26.3% |
Demographics Similar to Tlingit-Haida by Wage/Income Gap
In terms of wage/income gap, the demographic groups most similar to Tlingit-Haida are Moroccan (24.0%, a difference of 0.060%), Sudanese (24.0%, a difference of 0.060%), Tsimshian (23.9%, a difference of 0.33%), Yaqui (24.0%, a difference of 0.36%), and Immigrants from Albania (24.0%, a difference of 0.37%).
| Demographics | Rating | Rank | Wage/Income Gap |
| Immigrants | Sudan | 99.4 /100 | #97 | Exceptional 23.6% |
| Immigrants | Latin America | 99.2 /100 | #98 | Exceptional 23.7% |
| Aleuts | 99.2 /100 | #99 | Exceptional 23.7% |
| Yakama | 99.2 /100 | #100 | Exceptional 23.7% |
| Japanese | 99.1 /100 | #101 | Exceptional 23.8% |
| Immigrants | Laos | 99.0 /100 | #102 | Exceptional 23.8% |
| Tsimshian | 98.9 /100 | #103 | Exceptional 23.9% |
| Tlingit-Haida | 98.7 /100 | #104 | Exceptional 24.0% |
| Moroccans | 98.6 /100 | #105 | Exceptional 24.0% |
| Sudanese | 98.6 /100 | #106 | Exceptional 24.0% |
| Yaqui | 98.4 /100 | #107 | Exceptional 24.0% |
| Immigrants | Albania | 98.4 /100 | #108 | Exceptional 24.0% |
| Ugandans | 98.3 /100 | #109 | Exceptional 24.1% |
| Immigrants | Morocco | 98.1 /100 | #110 | Exceptional 24.1% |
| Soviet Union | 97.6 /100 | #111 | Exceptional 24.2% |