Immigrants from El Salvador vs Tlingit-Haida Wage/Income Gap
COMPARE
Immigrants from El Salvador
Tlingit-Haida
Wage/Income Gap
Wage/Income Gap Comparison
Immigrants from El Salvador
Tlingit-Haida
22.8%
WAGE/INCOME GAP
99.9/ 100
METRIC RATING
71st/ 347
METRIC RANK
24.0%
WAGE/INCOME GAP
98.7/ 100
METRIC RATING
104th/ 347
METRIC RANK
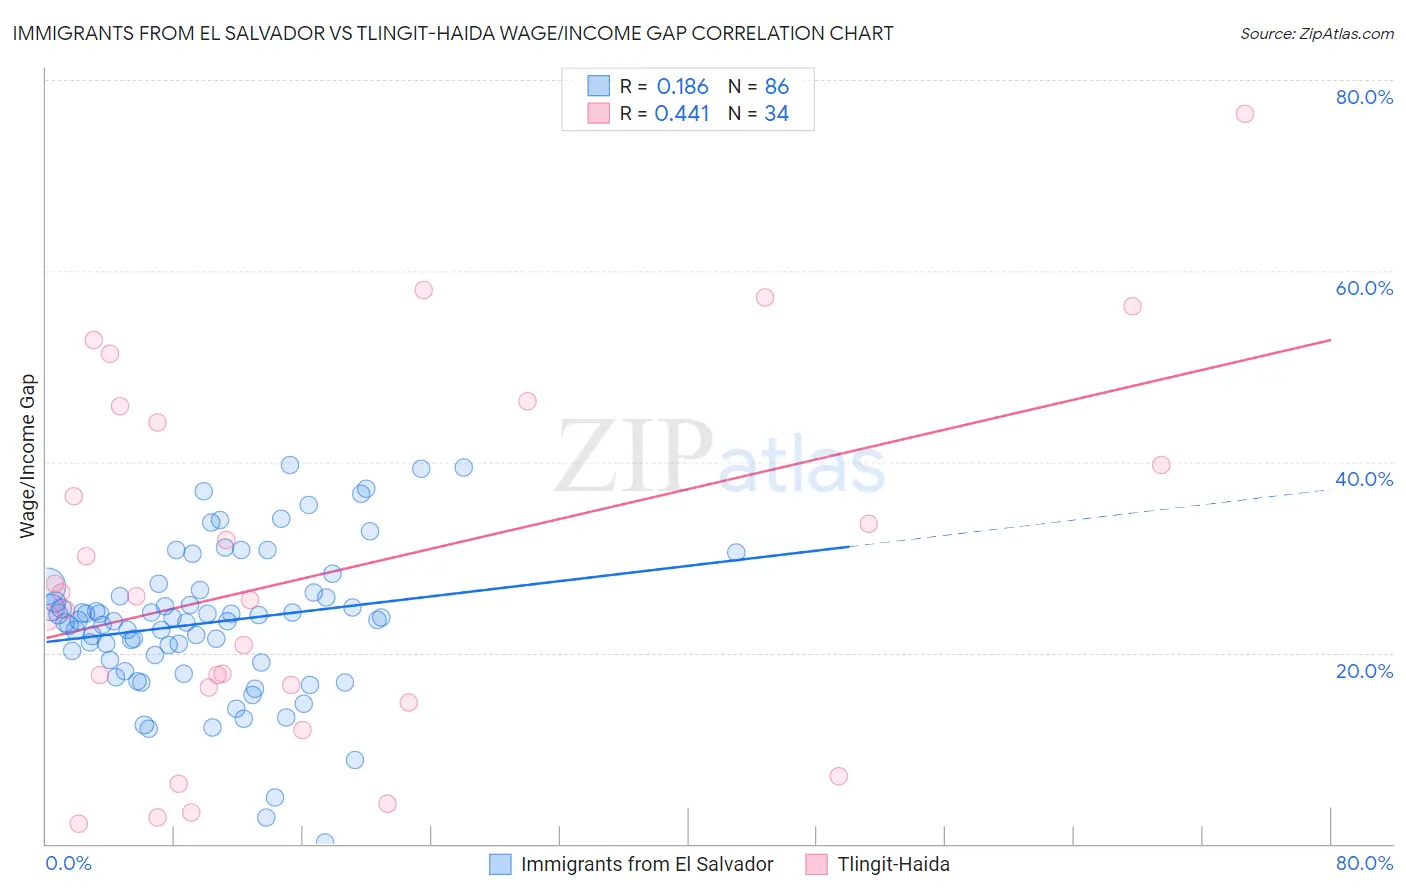
Immigrants from El Salvador vs Tlingit-Haida Wage/Income Gap Correlation Chart
The statistical analysis conducted on geographies consisting of 357,610,247 people shows a poor positive correlation between the proportion of Immigrants from El Salvador and wage/income gap percentage in the United States with a correlation coefficient (R) of 0.186 and weighted average of 22.8%. Similarly, the statistical analysis conducted on geographies consisting of 60,845,560 people shows a moderate positive correlation between the proportion of Tlingit-Haida and wage/income gap percentage in the United States with a correlation coefficient (R) of 0.441 and weighted average of 24.0%, a difference of 5.1%.
Wage/Income Gap Correlation Summary
| Measurement | Immigrants from El Salvador | Tlingit-Haida |
| Minimum | 0.18% | 2.1% |
| Maximum | 39.6% | 76.5% |
| Range | 39.4% | 74.4% |
| Mean | 23.2% | 28.6% |
| Median | 23.4% | 25.7% |
| Interquartile 25% (IQ1) | 19.2% | 16.3% |
| Interquartile 75% (IQ3) | 26.3% | 44.2% |
| Interquartile Range (IQR) | 7.1% | 27.9% |
| Standard Deviation (Sample) | 7.7% | 18.9% |
| Standard Deviation (Population) | 7.7% | 18.6% |
Similar Demographics by Wage/Income Gap
Demographics Similar to Immigrants from El Salvador by Wage/Income Gap
In terms of wage/income gap, the demographic groups most similar to Immigrants from El Salvador are Subsaharan African (22.8%, a difference of 0.15%), Immigrants from Uzbekistan (22.7%, a difference of 0.17%), Immigrants from Eastern Africa (22.8%, a difference of 0.18%), Immigrants from Burma/Myanmar (22.8%, a difference of 0.26%), and Indonesian (22.7%, a difference of 0.28%).
| Demographics | Rating | Rank | Wage/Income Gap |
| Spanish American Indians | 100.0 /100 | #64 | Exceptional 22.5% |
| Guatemalans | 99.9 /100 | #65 | Exceptional 22.6% |
| Central American Indians | 99.9 /100 | #66 | Exceptional 22.7% |
| Menominee | 99.9 /100 | #67 | Exceptional 22.7% |
| Immigrants | Nigeria | 99.9 /100 | #68 | Exceptional 22.7% |
| Indonesians | 99.9 /100 | #69 | Exceptional 22.7% |
| Immigrants | Uzbekistan | 99.9 /100 | #70 | Exceptional 22.7% |
| Immigrants | El Salvador | 99.9 /100 | #71 | Exceptional 22.8% |
| Sub-Saharan Africans | 99.9 /100 | #72 | Exceptional 22.8% |
| Immigrants | Eastern Africa | 99.9 /100 | #73 | Exceptional 22.8% |
| Immigrants | Burma/Myanmar | 99.9 /100 | #74 | Exceptional 22.8% |
| Fijians | 99.9 /100 | #75 | Exceptional 22.9% |
| Ecuadorians | 99.9 /100 | #76 | Exceptional 22.9% |
| Africans | 99.9 /100 | #77 | Exceptional 22.9% |
| Nigerians | 99.9 /100 | #78 | Exceptional 23.0% |
Demographics Similar to Tlingit-Haida by Wage/Income Gap
In terms of wage/income gap, the demographic groups most similar to Tlingit-Haida are Moroccan (24.0%, a difference of 0.060%), Sudanese (24.0%, a difference of 0.060%), Tsimshian (23.9%, a difference of 0.33%), Yaqui (24.0%, a difference of 0.36%), and Immigrants from Albania (24.0%, a difference of 0.37%).
| Demographics | Rating | Rank | Wage/Income Gap |
| Immigrants | Sudan | 99.4 /100 | #97 | Exceptional 23.6% |
| Immigrants | Latin America | 99.2 /100 | #98 | Exceptional 23.7% |
| Aleuts | 99.2 /100 | #99 | Exceptional 23.7% |
| Yakama | 99.2 /100 | #100 | Exceptional 23.7% |
| Japanese | 99.1 /100 | #101 | Exceptional 23.8% |
| Immigrants | Laos | 99.0 /100 | #102 | Exceptional 23.8% |
| Tsimshian | 98.9 /100 | #103 | Exceptional 23.9% |
| Tlingit-Haida | 98.7 /100 | #104 | Exceptional 24.0% |
| Moroccans | 98.6 /100 | #105 | Exceptional 24.0% |
| Sudanese | 98.6 /100 | #106 | Exceptional 24.0% |
| Yaqui | 98.4 /100 | #107 | Exceptional 24.0% |
| Immigrants | Albania | 98.4 /100 | #108 | Exceptional 24.0% |
| Ugandans | 98.3 /100 | #109 | Exceptional 24.1% |
| Immigrants | Morocco | 98.1 /100 | #110 | Exceptional 24.1% |
| Soviet Union | 97.6 /100 | #111 | Exceptional 24.2% |