Immigrants from Greece vs Immigrants from Australia Wage/Income Gap
COMPARE
Immigrants from Greece
Immigrants from Australia
Wage/Income Gap
Wage/Income Gap Comparison
Immigrants from Greece
Immigrants from Australia
25.7%
WAGE/INCOME GAP
56.6/ 100
METRIC RATING
171st/ 347
METRIC RANK
28.2%
WAGE/INCOME GAP
0.3/ 100
METRIC RATING
292nd/ 347
METRIC RANK
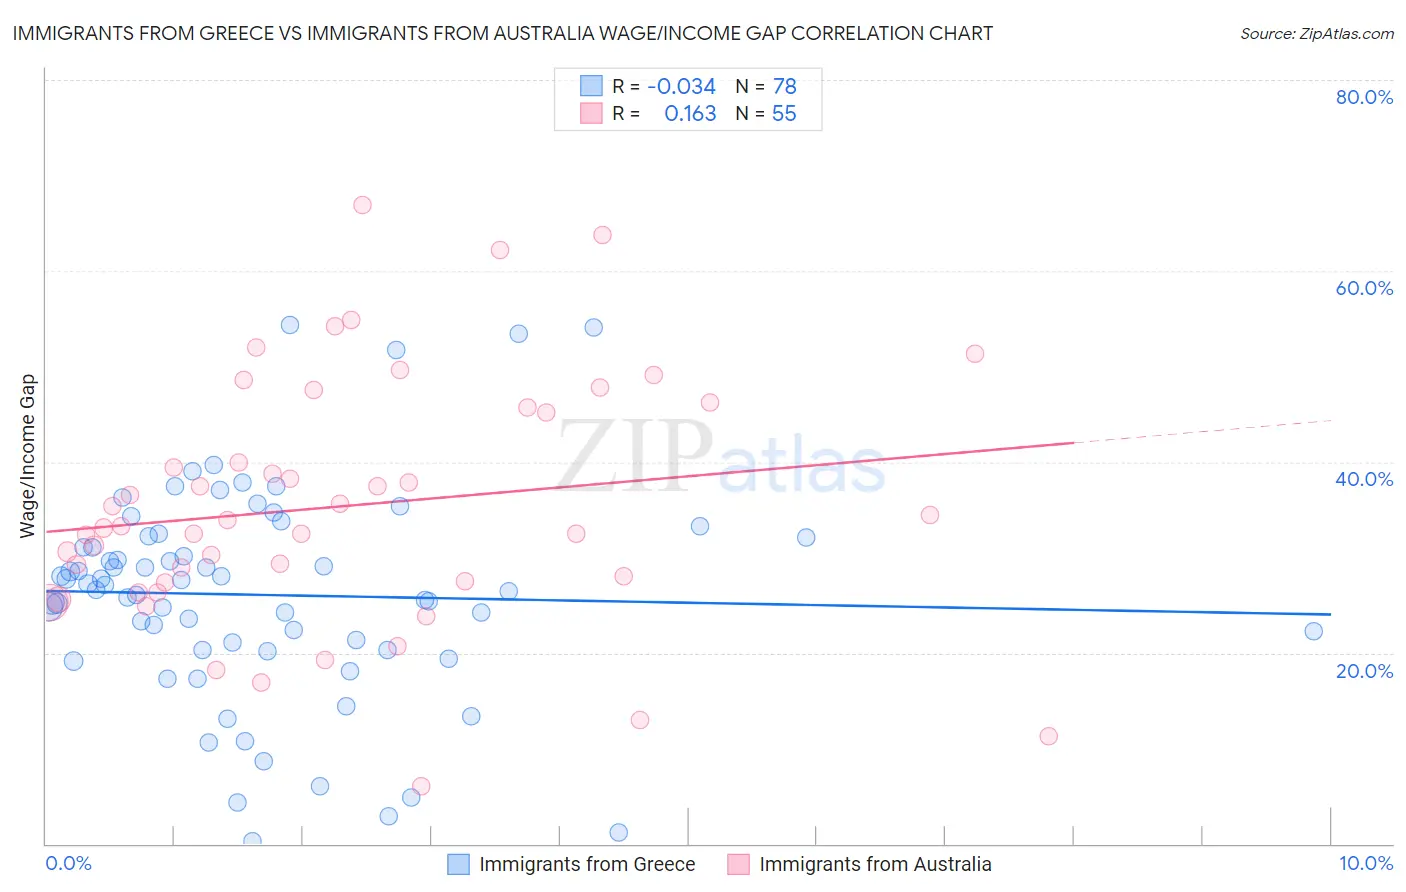
Immigrants from Greece vs Immigrants from Australia Wage/Income Gap Correlation Chart
The statistical analysis conducted on geographies consisting of 216,813,156 people shows no correlation between the proportion of Immigrants from Greece and wage/income gap percentage in the United States with a correlation coefficient (R) of -0.034 and weighted average of 25.7%. Similarly, the statistical analysis conducted on geographies consisting of 227,127,530 people shows a poor positive correlation between the proportion of Immigrants from Australia and wage/income gap percentage in the United States with a correlation coefficient (R) of 0.163 and weighted average of 28.2%, a difference of 10.0%.
Wage/Income Gap Correlation Summary
| Measurement | Immigrants from Greece | Immigrants from Australia |
| Minimum | 0.24% | 6.0% |
| Maximum | 54.3% | 66.9% |
| Range | 54.0% | 60.9% |
| Mean | 26.1% | 35.4% |
| Median | 26.8% | 33.2% |
| Interquartile 25% (IQ1) | 20.3% | 27.4% |
| Interquartile 75% (IQ3) | 32.0% | 45.7% |
| Interquartile Range (IQR) | 11.7% | 18.3% |
| Standard Deviation (Sample) | 11.2% | 13.0% |
| Standard Deviation (Population) | 11.1% | 12.9% |
Similar Demographics by Wage/Income Gap
Demographics Similar to Immigrants from Greece by Wage/Income Gap
In terms of wage/income gap, the demographic groups most similar to Immigrants from Greece are Immigrants from Oceania (25.6%, a difference of 0.060%), Immigrants from Chile (25.7%, a difference of 0.22%), Peruvian (25.6%, a difference of 0.23%), Immigrants from Belarus (25.7%, a difference of 0.24%), and Seminole (25.6%, a difference of 0.41%).
| Demographics | Rating | Rank | Wage/Income Gap |
| Koreans | 68.6 /100 | #164 | Good 25.4% |
| Immigrants | Hong Kong | 64.0 /100 | #165 | Good 25.5% |
| Immigrants | Ukraine | 63.8 /100 | #166 | Good 25.5% |
| Paiute | 62.9 /100 | #167 | Good 25.5% |
| Seminole | 62.6 /100 | #168 | Good 25.6% |
| Peruvians | 60.1 /100 | #169 | Good 25.6% |
| Immigrants | Oceania | 57.5 /100 | #170 | Average 25.6% |
| Immigrants | Greece | 56.6 /100 | #171 | Average 25.7% |
| Immigrants | Chile | 53.2 /100 | #172 | Average 25.7% |
| Immigrants | Belarus | 52.9 /100 | #173 | Average 25.7% |
| Alaskan Athabascans | 50.0 /100 | #174 | Average 25.8% |
| Sri Lankans | 47.0 /100 | #175 | Average 25.8% |
| Paraguayans | 46.7 /100 | #176 | Average 25.8% |
| Cambodians | 45.1 /100 | #177 | Average 25.8% |
| Chinese | 42.0 /100 | #178 | Average 25.9% |
Demographics Similar to Immigrants from Australia by Wage/Income Gap
In terms of wage/income gap, the demographic groups most similar to Immigrants from Australia are Czechoslovakian (28.2%, a difference of 0.060%), Immigrants from Israel (28.2%, a difference of 0.11%), Australian (28.2%, a difference of 0.12%), Greek (28.2%, a difference of 0.13%), and Canadian (28.1%, a difference of 0.22%).
| Demographics | Rating | Rank | Wage/Income Gap |
| Italians | 0.4 /100 | #285 | Tragic 28.1% |
| Immigrants | Austria | 0.4 /100 | #286 | Tragic 28.1% |
| Okinawans | 0.4 /100 | #287 | Tragic 28.1% |
| Choctaw | 0.4 /100 | #288 | Tragic 28.1% |
| Canadians | 0.3 /100 | #289 | Tragic 28.1% |
| Australians | 0.3 /100 | #290 | Tragic 28.2% |
| Czechoslovakians | 0.3 /100 | #291 | Tragic 28.2% |
| Immigrants | Australia | 0.3 /100 | #292 | Tragic 28.2% |
| Immigrants | Israel | 0.3 /100 | #293 | Tragic 28.2% |
| Greeks | 0.3 /100 | #294 | Tragic 28.2% |
| Slovenes | 0.3 /100 | #295 | Tragic 28.3% |
| Northern Europeans | 0.3 /100 | #296 | Tragic 28.3% |
| Immigrants | North America | 0.2 /100 | #297 | Tragic 28.4% |
| Austrians | 0.2 /100 | #298 | Tragic 28.4% |
| Immigrants | North Macedonia | 0.2 /100 | #299 | Tragic 28.4% |