Immigrants from Israel vs South American Indian Wage/Income Gap
COMPARE
Immigrants from Israel
South American Indian
Wage/Income Gap
Wage/Income Gap Comparison
Immigrants from Israel
South American Indians
28.2%
WAGE/INCOME GAP
0.3/ 100
METRIC RATING
293rd/ 347
METRIC RANK
24.7%
WAGE/INCOME GAP
92.0/ 100
METRIC RATING
135th/ 347
METRIC RANK
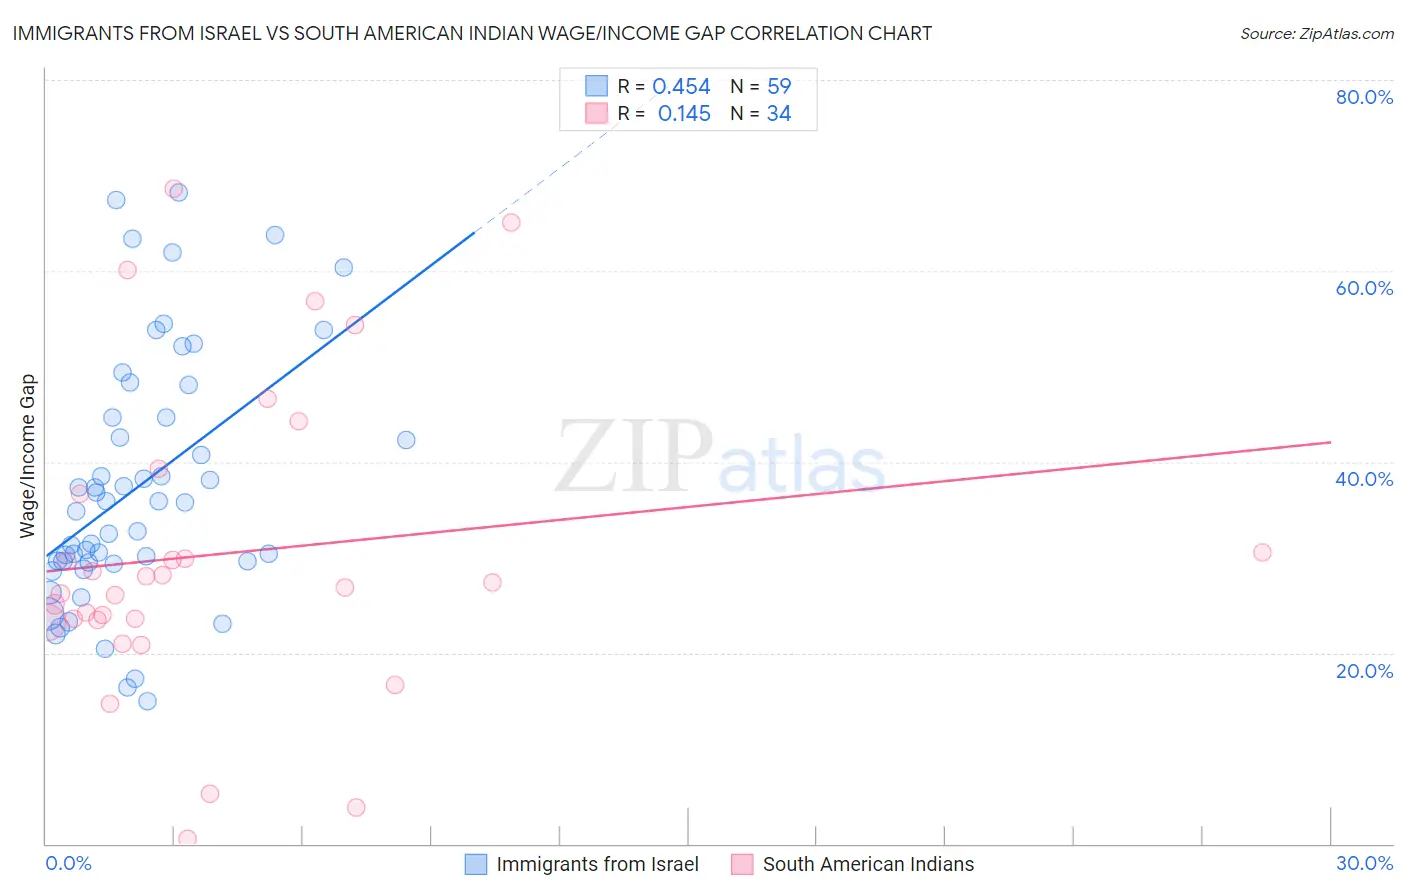
Immigrants from Israel vs South American Indian Wage/Income Gap Correlation Chart
The statistical analysis conducted on geographies consisting of 209,965,459 people shows a moderate positive correlation between the proportion of Immigrants from Israel and wage/income gap percentage in the United States with a correlation coefficient (R) of 0.454 and weighted average of 28.2%. Similarly, the statistical analysis conducted on geographies consisting of 164,540,289 people shows a poor positive correlation between the proportion of South American Indians and wage/income gap percentage in the United States with a correlation coefficient (R) of 0.145 and weighted average of 24.7%, a difference of 14.1%.
Wage/Income Gap Correlation Summary
| Measurement | Immigrants from Israel | South American Indian |
| Minimum | 15.0% | 0.52% |
| Maximum | 68.2% | 68.7% |
| Range | 53.2% | 68.1% |
| Mean | 37.4% | 30.4% |
| Median | 35.8% | 27.1% |
| Interquartile 25% (IQ1) | 29.5% | 23.4% |
| Interquartile 75% (IQ3) | 44.7% | 36.7% |
| Interquartile Range (IQR) | 15.2% | 13.2% |
| Standard Deviation (Sample) | 13.1% | 16.2% |
| Standard Deviation (Population) | 13.0% | 15.9% |
Similar Demographics by Wage/Income Gap
Demographics Similar to Immigrants from Israel by Wage/Income Gap
In terms of wage/income gap, the demographic groups most similar to Immigrants from Israel are Greek (28.2%, a difference of 0.020%), Immigrants from Australia (28.2%, a difference of 0.11%), Slovene (28.3%, a difference of 0.15%), Czechoslovakian (28.2%, a difference of 0.16%), and Northern European (28.3%, a difference of 0.16%).
| Demographics | Rating | Rank | Wage/Income Gap |
| Immigrants | Austria | 0.4 /100 | #286 | Tragic 28.1% |
| Okinawans | 0.4 /100 | #287 | Tragic 28.1% |
| Choctaw | 0.4 /100 | #288 | Tragic 28.1% |
| Canadians | 0.3 /100 | #289 | Tragic 28.1% |
| Australians | 0.3 /100 | #290 | Tragic 28.2% |
| Czechoslovakians | 0.3 /100 | #291 | Tragic 28.2% |
| Immigrants | Australia | 0.3 /100 | #292 | Tragic 28.2% |
| Immigrants | Israel | 0.3 /100 | #293 | Tragic 28.2% |
| Greeks | 0.3 /100 | #294 | Tragic 28.2% |
| Slovenes | 0.3 /100 | #295 | Tragic 28.3% |
| Northern Europeans | 0.3 /100 | #296 | Tragic 28.3% |
| Immigrants | North America | 0.2 /100 | #297 | Tragic 28.4% |
| Austrians | 0.2 /100 | #298 | Tragic 28.4% |
| Immigrants | North Macedonia | 0.2 /100 | #299 | Tragic 28.4% |
| Immigrants | Northern Europe | 0.2 /100 | #300 | Tragic 28.5% |
Demographics Similar to South American Indians by Wage/Income Gap
In terms of wage/income gap, the demographic groups most similar to South American Indians are Mexican American Indian (24.7%, a difference of 0.060%), Colombian (24.7%, a difference of 0.090%), Immigrants from Costa Rica (24.7%, a difference of 0.10%), Armenian (24.8%, a difference of 0.14%), and Immigrants from South Eastern Asia (24.8%, a difference of 0.23%).
| Demographics | Rating | Rank | Wage/Income Gap |
| Immigrants | Central America | 93.5 /100 | #128 | Exceptional 24.6% |
| Yup'ik | 93.3 /100 | #129 | Exceptional 24.7% |
| Alsatians | 93.2 /100 | #130 | Exceptional 24.7% |
| Immigrants | Philippines | 93.0 /100 | #131 | Exceptional 24.7% |
| Immigrants | Costa Rica | 92.4 /100 | #132 | Exceptional 24.7% |
| Colombians | 92.4 /100 | #133 | Exceptional 24.7% |
| Mexican American Indians | 92.2 /100 | #134 | Exceptional 24.7% |
| South American Indians | 92.0 /100 | #135 | Exceptional 24.7% |
| Armenians | 91.3 /100 | #136 | Exceptional 24.8% |
| Immigrants | South Eastern Asia | 90.9 /100 | #137 | Exceptional 24.8% |
| Immigrants | Bosnia and Herzegovina | 90.1 /100 | #138 | Exceptional 24.8% |
| Hispanics or Latinos | 89.5 /100 | #139 | Excellent 24.9% |
| Immigrants | Nepal | 89.3 /100 | #140 | Excellent 24.9% |
| Hawaiians | 89.3 /100 | #141 | Excellent 24.9% |
| Afghans | 88.1 /100 | #142 | Excellent 24.9% |