Immigrants from Eritrea vs Immigrants from Australia In Labor Force | Age 45-54

COMPARE

Immigrants from Eritrea
Race
Ancestry
AfghanAfricanAlaska NativeAlaskan AthabascanAlbanianAleutAlsatianAmericanApacheArabArapahoArgentineanArmenianAssyrian/Chaldean/SyriacAustralianAustrianBahamianBangladeshiBarbadianBasqueBelgianBelizeanBermudanBhutaneseBlackfeetBolivianBrazilianBritishBritish West IndianBulgarianBurmeseCajunCambodianCanadianCape VerdeanCarpatho RusynCelticCentral AmericanCentral American IndianCherokeeCheyenneChickasawChileanChineseChippewaChoctawColombianColvilleComancheCosta RicanCreeCreekCroatianCrowCubanCypriotCzechCzechoslovakianDanishDelawareDominicanDutchDutch West IndianEastern EuropeanEcuadorianEgyptianEnglishEstonianEthiopianEuropeanFijianFilipinoFinnishFrenchFrench American IndianFrench CanadianGermanGerman RussianGhanaianGreekGuamanian/ChamorroGuatemalanGuyaneseHaitianHmongHonduranHopiHoumaHungarianIcelanderIndian (Asian)IndonesianInupiatIranianIraqiIrishIroquoisIsraeliItalianJamaicanJapaneseJordanianKenyanKiowaKoreanLaotianLatvianLebaneseLiberianLithuanianLumbeeLuxembourgerMacedonianMalaysianMalteseMarshalleseMenomineeMexicanMexican American IndianMongolianMoroccanNative HawaiianNavajoNepaleseNew ZealanderNicaraguanNigerianNorthern EuropeanNorwegianOkinawanOsageOttawaPaiutePakistaniPalestinianPanamanianParaguayanPennsylvania GermanPeruvianPimaPolishPortuguesePotawatomiPuebloPuerto RicanPuget Sound SalishRomanianRussianSalvadoranSamoanScandinavianScotch-IrishScottishSeminoleSenegaleseSerbianShoshoneSierra LeoneanSiouxSlavicSlovakSloveneSomaliSouth AfricanSouth AmericanSouth American IndianSoviet UnionSpaniardSpanishSpanish AmericanSpanish American IndianSri LankanSubsaharan AfricanSudaneseSwedishSwissSyrianTaiwaneseThaiTlingit-HaidaTohono O'OdhamTonganTrinidadian and TobagonianTsimshianTurkishU.S. Virgin IslanderUgandanUkrainianUruguayanUteVenezuelanVietnameseWelshWest IndianYakamaYaquiYugoslavianYumanYup'ikZimbabwean
Immigration
NonimmigrantsImmigrantsAfghanistanAfricaAlbaniaArgentinaArmeniaAsiaAustriaBahamasBangladeshBarbadosBelarusBelgiumBelizeBoliviaBosnia and HerzegovinaBrazilBulgariaBurma/MyanmarCabo VerdeCambodiaCameroonCanadaCaribbeanCentral AmericaChileChinaColombiaCongoCosta RicaCroatiaCubaCzechoslovakiaDenmarkDominicaDominican RepublicEastern AfricaEastern AsiaEastern EuropeEcuadorEgyptEl SalvadorEnglandEritreaEthiopiaEuropeFijiFranceGermanyGhanaGreeceGrenadaGuatemalaGuyanaHaitiHondurasHong KongHungaryIndiaIndonesiaIranIraqIrelandIsraelItalyJamaicaJapanJordanKazakhstanKenyaKoreaKuwaitLaosLatin AmericaLatviaLebanonLiberiaLithuaniaMalaysiaMexicoMicronesiaMiddle AfricaMoldovaMoroccoNepalNetherlandsNicaraguaNigeriaNorth AmericaNorth MacedoniaNorthern AfricaNorthern EuropeNorwayOceaniaPakistanPanamaPeruPhilippinesPolandPortugalRomaniaRussiaSaudi ArabiaScotlandSenegalSerbiaSierra LeoneSingaporeSomaliaSouth AfricaSouth AmericaSouth Central AsiaSouth Eastern AsiaSouthern EuropeSpainSri LankaSt. Vincent and the GrenadinesSudanSwedenSwitzerlandSyriaTaiwanThailandTrinidad and TobagoTurkeyUgandaUkraineUruguayUzbekistanVenezuelaVietnamWest IndiesWestern AfricaWestern AsiaWestern EuropeYemenZaireZimbabweAzores
Immigrants from Australia
Race
Ancestry
AfghanAfricanAlaska NativeAlaskan AthabascanAlbanianAleutAlsatianAmericanApacheArabArapahoArgentineanArmenianAssyrian/Chaldean/SyriacAustralianAustrianBahamianBangladeshiBarbadianBasqueBelgianBelizeanBermudanBhutaneseBlackfeetBolivianBrazilianBritishBritish West IndianBulgarianBurmeseCajunCambodianCanadianCape VerdeanCarpatho RusynCelticCentral AmericanCentral American IndianCherokeeCheyenneChickasawChileanChineseChippewaChoctawColombianColvilleComancheCosta RicanCreeCreekCroatianCrowCubanCypriotCzechCzechoslovakianDanishDelawareDominicanDutchDutch West IndianEastern EuropeanEcuadorianEgyptianEnglishEstonianEthiopianEuropeanFijianFilipinoFinnishFrenchFrench American IndianFrench CanadianGermanGerman RussianGhanaianGreekGuamanian/ChamorroGuatemalanGuyaneseHaitianHmongHonduranHopiHoumaHungarianIcelanderIndian (Asian)IndonesianInupiatIranianIraqiIrishIroquoisIsraeliItalianJamaicanJapaneseJordanianKenyanKiowaKoreanLaotianLatvianLebaneseLiberianLithuanianLumbeeLuxembourgerMacedonianMalaysianMalteseMarshalleseMenomineeMexicanMexican American IndianMongolianMoroccanNative HawaiianNavajoNepaleseNew ZealanderNicaraguanNigerianNorthern EuropeanNorwegianOkinawanOsageOttawaPaiutePakistaniPalestinianPanamanianParaguayanPennsylvania GermanPeruvianPimaPolishPortuguesePotawatomiPuebloPuerto RicanPuget Sound SalishRomanianRussianSalvadoranSamoanScandinavianScotch-IrishScottishSeminoleSenegaleseSerbianShoshoneSierra LeoneanSiouxSlavicSlovakSloveneSomaliSouth AfricanSouth AmericanSouth American IndianSoviet UnionSpaniardSpanishSpanish AmericanSpanish American IndianSri LankanSubsaharan AfricanSudaneseSwedishSwissSyrianTaiwaneseThaiTlingit-HaidaTohono O'OdhamTonganTrinidadian and TobagonianTsimshianTurkishU.S. Virgin IslanderUgandanUkrainianUruguayanUteVenezuelanVietnameseWelshWest IndianYakamaYaquiYugoslavianYumanYup'ikZimbabwean
Immigration
NonimmigrantsImmigrantsAfghanistanAfricaAlbaniaArgentinaArmeniaAsiaAustraliaAustriaBahamasBangladeshBarbadosBelarusBelgiumBelizeBoliviaBosnia and HerzegovinaBrazilBulgariaBurma/MyanmarCabo VerdeCambodiaCameroonCanadaCaribbeanCentral AmericaChileChinaColombiaCongoCosta RicaCroatiaCubaCzechoslovakiaDenmarkDominicaDominican RepublicEastern AfricaEastern AsiaEastern EuropeEcuadorEgyptEl SalvadorEnglandEthiopiaEuropeFijiFranceGermanyGhanaGreeceGrenadaGuatemalaGuyanaHaitiHondurasHong KongHungaryIndiaIndonesiaIranIraqIrelandIsraelItalyJamaicaJapanJordanKazakhstanKenyaKoreaKuwaitLaosLatin AmericaLatviaLebanonLiberiaLithuaniaMalaysiaMexicoMicronesiaMiddle AfricaMoldovaMoroccoNepalNetherlandsNicaraguaNigeriaNorth AmericaNorth MacedoniaNorthern AfricaNorthern EuropeNorwayOceaniaPakistanPanamaPeruPhilippinesPolandPortugalRomaniaRussiaSaudi ArabiaScotlandSenegalSerbiaSierra LeoneSingaporeSomaliaSouth AfricaSouth AmericaSouth Central AsiaSouth Eastern AsiaSouthern EuropeSpainSri LankaSt. Vincent and the GrenadinesSudanSwedenSwitzerlandSyriaTaiwanThailandTrinidad and TobagoTurkeyUgandaUkraineUruguayUzbekistanVenezuelaVietnamWest IndiesWestern AfricaWestern AsiaWestern EuropeYemenZaireZimbabweAzores
In Labor Force | Age 45-54
Income
Poverty
Unemployment
Labor Participation
Family Structure
Vehicle Availability
Education Level
Disability

In Labor Force | Age 45-54 Comparison

Immigrants from Eritrea

Immigrants from Australia

Exceptional
Good
83.8%
IN LABOR FORCE | AGE 45-54
99.7/ 100
METRIC RATING
31st/ 347
METRIC RANK
82.9%
IN LABOR FORCE | AGE 45-54
68.2/ 100
METRIC RATING
157th/ 347
METRIC RANK

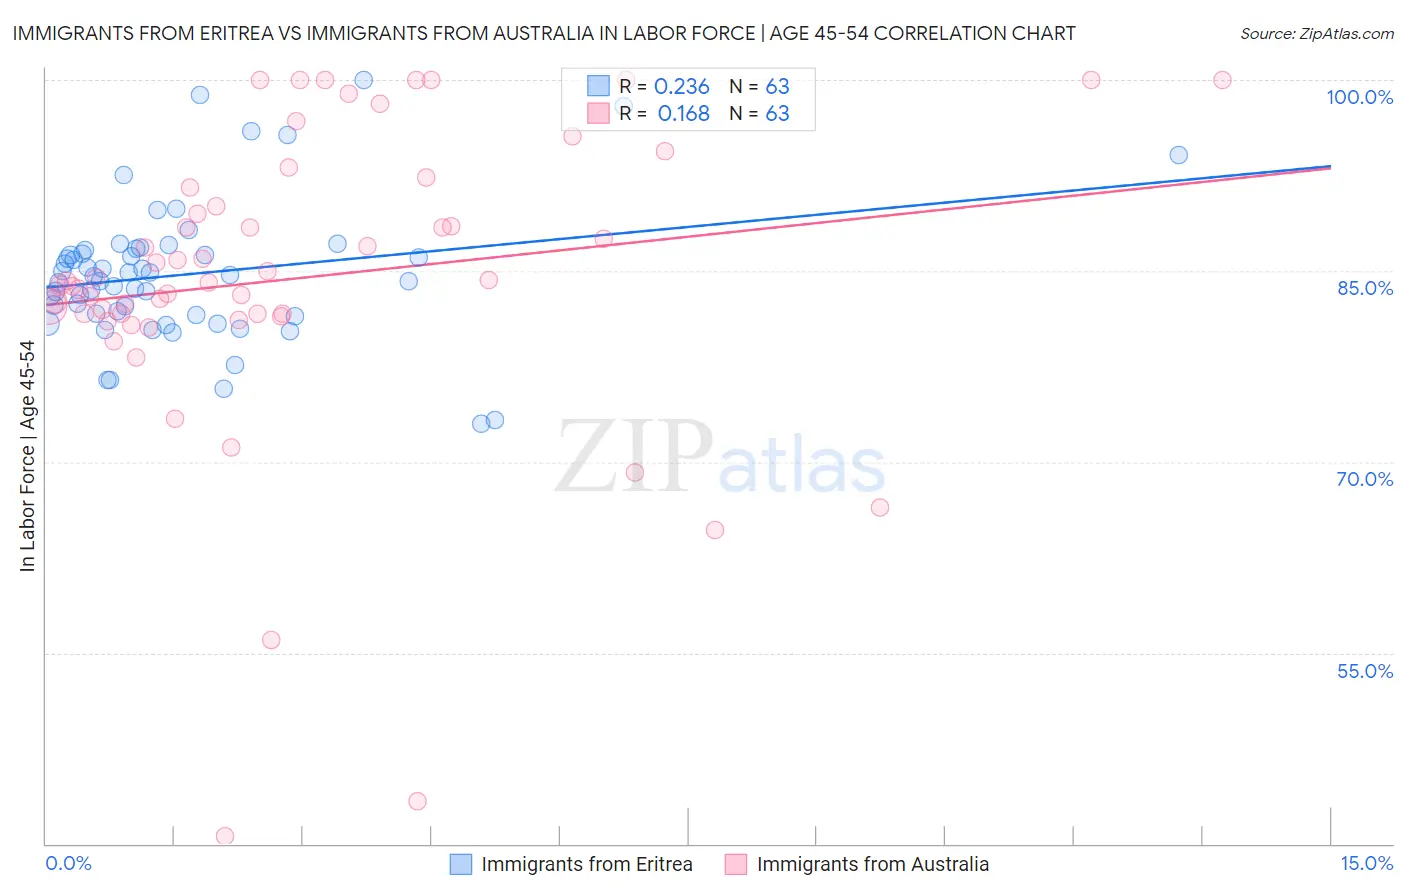
Immigrants from Eritrea vs Immigrants from Australia In Labor Force | Age 45-54 Correlation Chart

The statistical analysis conducted on geographies consisting of 104,844,448 people shows a weak positive correlation between the proportion of Immigrants from Eritrea and labor force participation rate among population between the ages 45 and 54 in the United States with a correlation coefficient (R) of 0.236 and weighted average of 83.8%. Similarly, the statistical analysis conducted on geographies consisting of 227,126,379 people shows a poor positive correlation between the proportion of Immigrants from Australia and labor force participation rate among population between the ages 45 and 54 in the United States with a correlation coefficient (R) of 0.168 and weighted average of 82.9%, a difference of 1.1%.
Immigrants from Eritrea vs Immigrants from Australia In Labor Force | Age 45-54

In Labor Force | Age 45-54 Correlation Summary

MeasurementImmigrants from EritreaImmigrants from Australia
Minimum73.0%40.6%
Maximum100.0%100.0%
Range27.0%59.4%
Mean84.7%84.5%
Median84.6%84.2%
Interquartile 25% (IQ1)81.5%81.6%
Interquartile 75% (IQ3)86.7%91.5%
Interquartile Range (IQR)5.2%9.9%
Standard Deviation (Sample)5.5%12.0%
Standard Deviation (Population)5.4%11.9%

Similar Demographics by In Labor Force | Age 45-54

Demographics Similar to Immigrants from Eritrea by In Labor Force | Age 45-54

In terms of in labor force | age 45-54, the demographic groups most similar to Immigrants from Eritrea are Immigrants from Bulgaria (83.8%, a difference of 0.020%), Turkish (83.8%, a difference of 0.020%), Latvian (83.8%, a difference of 0.020%), Immigrants from Pakistan (83.8%, a difference of 0.050%), and Immigrants from Lithuania (83.9%, a difference of 0.070%).
DemographicsRating | RankIn Labor Force | Age 45-54
Slovenes
99.8
/100
|
#24
Exceptional
83.9%
Immigrants | North Macedonia
99.8
/100
|
#25
Exceptional
83.9%
Immigrants | Serbia
99.8
/100
|
#26
Exceptional
83.9%
Immigrants | Brazil
99.8
/100
|
#27
Exceptional
83.9%
Immigrants | Lithuania
99.8
/100
|
#28
Exceptional
83.9%
Immigrants | Pakistan
99.7
/100
|
#29
Exceptional
83.8%
Immigrants | Bulgaria
99.7
/100
|
#30
Exceptional
83.8%
Immigrants | Eritrea
99.7
/100
|
#31
Exceptional
83.8%
Turks
99.7
/100
|
#32
Exceptional
83.8%
Latvians
99.7
/100
|
#33
Exceptional
83.8%
Kenyans
99.5
/100
|
#34
Exceptional
83.7%
Brazilians
99.5
/100
|
#35
Exceptional
83.7%
Ugandans
99.5
/100
|
#36
Exceptional
83.7%
Swedes
99.4
/100
|
#37
Exceptional
83.7%
Immigrants | Venezuela
99.4
/100
|
#38
Exceptional
83.7%

Demographics Similar to Immigrants from Australia by In Labor Force | Age 45-54

In terms of in labor force | age 45-54, the demographic groups most similar to Immigrants from Australia are Immigrants from Southern Europe (82.9%, a difference of 0.0%), Immigrants from Philippines (82.9%, a difference of 0.010%), Immigrants from Saudi Arabia (82.9%, a difference of 0.010%), Immigrants from Indonesia (82.9%, a difference of 0.020%), and Immigrants from Ghana (82.9%, a difference of 0.020%).
DemographicsRating | RankIn Labor Force | Age 45-54
Immigrants | Netherlands
72.6
/100
|
#150
Good
82.9%
Koreans
71.9
/100
|
#151
Good
82.9%
Slavs
71.5
/100
|
#152
Good
82.9%
Immigrants | Indonesia
70.6
/100
|
#153
Good
82.9%
Immigrants | Ghana
70.3
/100
|
#154
Good
82.9%
Immigrants | Philippines
69.0
/100
|
#155
Good
82.9%
Immigrants | Saudi Arabia
68.8
/100
|
#156
Good
82.9%
Immigrants | Australia
68.2
/100
|
#157
Good
82.9%
Immigrants | Southern Europe
67.8
/100
|
#158
Good
82.9%
Immigrants | Austria
64.6
/100
|
#159
Good
82.9%
Laotians
62.8
/100
|
#160
Good
82.9%
South American Indians
62.2
/100
|
#161
Good
82.9%
Haitians
61.8
/100
|
#162
Good
82.8%
Dutch
61.7
/100
|
#163
Good
82.8%
German Russians
61.3
/100
|
#164
Good
82.8%