Lithuanian vs Immigrants from Australia Wage/Income Gap
COMPARE
Lithuanian
Immigrants from Australia
Wage/Income Gap
Wage/Income Gap Comparison
Lithuanians
Immigrants from Australia
28.7%
WAGE/INCOME GAP
0.1/ 100
METRIC RATING
316th/ 347
METRIC RANK
28.2%
WAGE/INCOME GAP
0.3/ 100
METRIC RATING
292nd/ 347
METRIC RANK
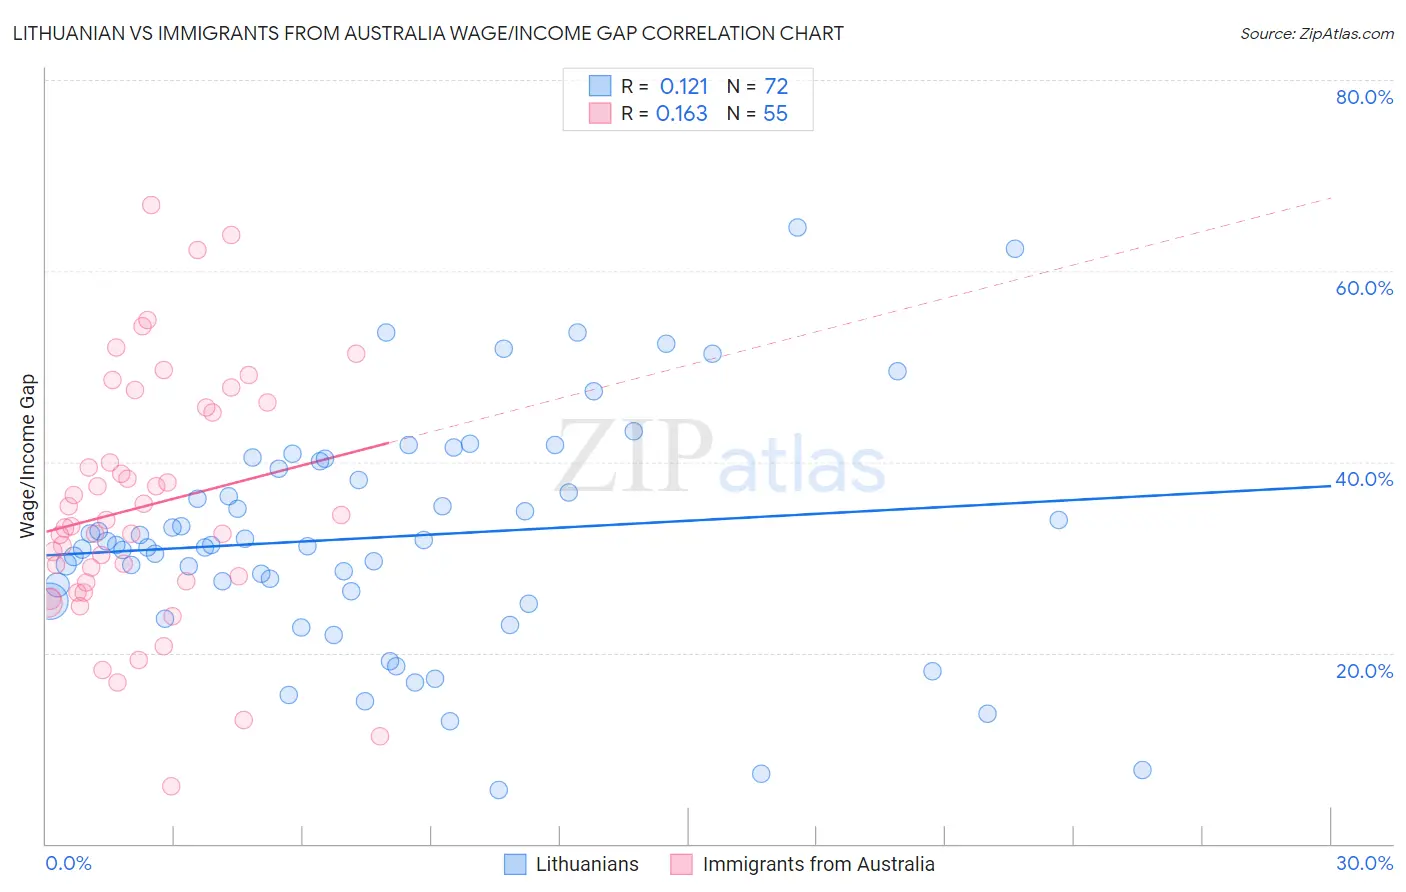
Lithuanian vs Immigrants from Australia Wage/Income Gap Correlation Chart
The statistical analysis conducted on geographies consisting of 421,511,979 people shows a poor positive correlation between the proportion of Lithuanians and wage/income gap percentage in the United States with a correlation coefficient (R) of 0.121 and weighted average of 28.7%. Similarly, the statistical analysis conducted on geographies consisting of 227,127,530 people shows a poor positive correlation between the proportion of Immigrants from Australia and wage/income gap percentage in the United States with a correlation coefficient (R) of 0.163 and weighted average of 28.2%, a difference of 1.9%.
Wage/Income Gap Correlation Summary
| Measurement | Lithuanian | Immigrants from Australia |
| Minimum | 5.6% | 6.0% |
| Maximum | 64.5% | 66.9% |
| Range | 58.9% | 60.9% |
| Mean | 32.1% | 35.4% |
| Median | 31.3% | 33.2% |
| Interquartile 25% (IQ1) | 25.9% | 27.4% |
| Interquartile 75% (IQ3) | 39.7% | 45.7% |
| Interquartile Range (IQR) | 13.8% | 18.3% |
| Standard Deviation (Sample) | 12.1% | 13.0% |
| Standard Deviation (Population) | 12.0% | 12.9% |
Similar Demographics by Wage/Income Gap
Demographics Similar to Lithuanians by Wage/Income Gap
In terms of wage/income gap, the demographic groups most similar to Lithuanians are Maltese (28.7%, a difference of 0.010%), Immigrants from Scotland (28.7%, a difference of 0.060%), Belgian (28.8%, a difference of 0.11%), Basque (28.8%, a difference of 0.16%), and French (28.7%, a difference of 0.20%).
| Demographics | Rating | Rank | Wage/Income Gap |
| Macedonians | 0.1 /100 | #309 | Tragic 28.6% |
| Finns | 0.1 /100 | #310 | Tragic 28.6% |
| Immigrants | Lithuania | 0.1 /100 | #311 | Tragic 28.6% |
| Eastern Europeans | 0.1 /100 | #312 | Tragic 28.6% |
| French | 0.1 /100 | #313 | Tragic 28.7% |
| Immigrants | Scotland | 0.1 /100 | #314 | Tragic 28.7% |
| Maltese | 0.1 /100 | #315 | Tragic 28.7% |
| Lithuanians | 0.1 /100 | #316 | Tragic 28.7% |
| Belgians | 0.1 /100 | #317 | Tragic 28.8% |
| Basques | 0.1 /100 | #318 | Tragic 28.8% |
| Slovaks | 0.1 /100 | #319 | Tragic 28.9% |
| British | 0.1 /100 | #320 | Tragic 28.9% |
| Welsh | 0.1 /100 | #321 | Tragic 28.9% |
| Immigrants | Singapore | 0.1 /100 | #322 | Tragic 28.9% |
| Norwegians | 0.1 /100 | #323 | Tragic 29.0% |
Demographics Similar to Immigrants from Australia by Wage/Income Gap
In terms of wage/income gap, the demographic groups most similar to Immigrants from Australia are Czechoslovakian (28.2%, a difference of 0.060%), Immigrants from Israel (28.2%, a difference of 0.11%), Australian (28.2%, a difference of 0.12%), Greek (28.2%, a difference of 0.13%), and Canadian (28.1%, a difference of 0.22%).
| Demographics | Rating | Rank | Wage/Income Gap |
| Italians | 0.4 /100 | #285 | Tragic 28.1% |
| Immigrants | Austria | 0.4 /100 | #286 | Tragic 28.1% |
| Okinawans | 0.4 /100 | #287 | Tragic 28.1% |
| Choctaw | 0.4 /100 | #288 | Tragic 28.1% |
| Canadians | 0.3 /100 | #289 | Tragic 28.1% |
| Australians | 0.3 /100 | #290 | Tragic 28.2% |
| Czechoslovakians | 0.3 /100 | #291 | Tragic 28.2% |
| Immigrants | Australia | 0.3 /100 | #292 | Tragic 28.2% |
| Immigrants | Israel | 0.3 /100 | #293 | Tragic 28.2% |
| Greeks | 0.3 /100 | #294 | Tragic 28.2% |
| Slovenes | 0.3 /100 | #295 | Tragic 28.3% |
| Northern Europeans | 0.3 /100 | #296 | Tragic 28.3% |
| Immigrants | North America | 0.2 /100 | #297 | Tragic 28.4% |
| Austrians | 0.2 /100 | #298 | Tragic 28.4% |
| Immigrants | North Macedonia | 0.2 /100 | #299 | Tragic 28.4% |