West Indian vs Immigrants from Australia Wage/Income Gap
COMPARE
West Indian
Immigrants from Australia
Wage/Income Gap
Wage/Income Gap Comparison
West Indians
Immigrants from Australia
19.6%
WAGE/INCOME GAP
100.0/ 100
METRIC RATING
15th/ 347
METRIC RANK
28.2%
WAGE/INCOME GAP
0.3/ 100
METRIC RATING
292nd/ 347
METRIC RANK
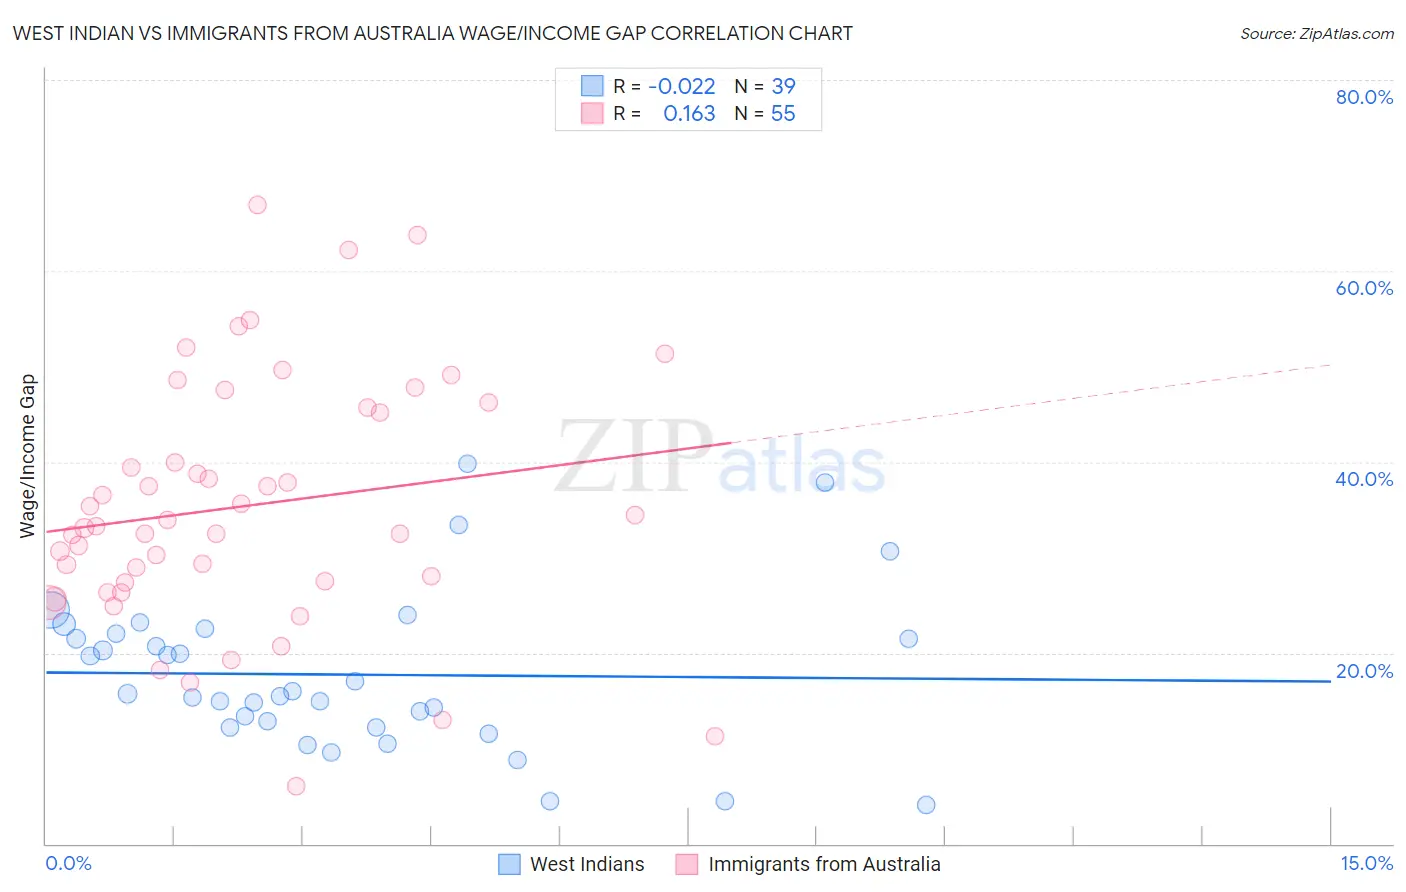
West Indian vs Immigrants from Australia Wage/Income Gap Correlation Chart
The statistical analysis conducted on geographies consisting of 253,957,443 people shows no correlation between the proportion of West Indians and wage/income gap percentage in the United States with a correlation coefficient (R) of -0.022 and weighted average of 19.6%. Similarly, the statistical analysis conducted on geographies consisting of 227,127,530 people shows a poor positive correlation between the proportion of Immigrants from Australia and wage/income gap percentage in the United States with a correlation coefficient (R) of 0.163 and weighted average of 28.2%, a difference of 44.2%.
Wage/Income Gap Correlation Summary
| Measurement | West Indian | Immigrants from Australia |
| Minimum | 4.0% | 6.0% |
| Maximum | 39.8% | 66.9% |
| Range | 35.8% | 60.9% |
| Mean | 17.7% | 35.4% |
| Median | 15.7% | 33.2% |
| Interquartile 25% (IQ1) | 12.2% | 27.4% |
| Interquartile 75% (IQ3) | 22.0% | 45.7% |
| Interquartile Range (IQR) | 9.8% | 18.3% |
| Standard Deviation (Sample) | 8.2% | 13.0% |
| Standard Deviation (Population) | 8.1% | 12.9% |
Similar Demographics by Wage/Income Gap
Demographics Similar to West Indians by Wage/Income Gap
In terms of wage/income gap, the demographic groups most similar to West Indians are Jamaican (19.6%, a difference of 0.12%), Haitian (19.7%, a difference of 0.91%), Immigrants from Trinidad and Tobago (19.3%, a difference of 1.2%), Trinidadian and Tobagonian (19.3%, a difference of 1.2%), and Immigrants from West Indies (19.2%, a difference of 1.7%).
| Demographics | Rating | Rank | Wage/Income Gap |
| Immigrants | Jamaica | 100.0 /100 | #8 | Exceptional 18.8% |
| Barbadians | 100.0 /100 | #9 | Exceptional 19.0% |
| Crow | 100.0 /100 | #10 | Exceptional 19.1% |
| Immigrants | Haiti | 100.0 /100 | #11 | Exceptional 19.2% |
| Immigrants | West Indies | 100.0 /100 | #12 | Exceptional 19.2% |
| Trinidadians and Tobagonians | 100.0 /100 | #13 | Exceptional 19.3% |
| Immigrants | Trinidad and Tobago | 100.0 /100 | #14 | Exceptional 19.3% |
| West Indians | 100.0 /100 | #15 | Exceptional 19.6% |
| Jamaicans | 100.0 /100 | #16 | Exceptional 19.6% |
| Haitians | 100.0 /100 | #17 | Exceptional 19.7% |
| Hopi | 100.0 /100 | #18 | Exceptional 20.0% |
| Immigrants | Dominica | 100.0 /100 | #19 | Exceptional 20.0% |
| Bahamians | 100.0 /100 | #20 | Exceptional 20.2% |
| Immigrants | Caribbean | 100.0 /100 | #21 | Exceptional 20.4% |
| Immigrants | Liberia | 100.0 /100 | #22 | Exceptional 20.6% |
Demographics Similar to Immigrants from Australia by Wage/Income Gap
In terms of wage/income gap, the demographic groups most similar to Immigrants from Australia are Czechoslovakian (28.2%, a difference of 0.060%), Immigrants from Israel (28.2%, a difference of 0.11%), Australian (28.2%, a difference of 0.12%), Greek (28.2%, a difference of 0.13%), and Canadian (28.1%, a difference of 0.22%).
| Demographics | Rating | Rank | Wage/Income Gap |
| Italians | 0.4 /100 | #285 | Tragic 28.1% |
| Immigrants | Austria | 0.4 /100 | #286 | Tragic 28.1% |
| Okinawans | 0.4 /100 | #287 | Tragic 28.1% |
| Choctaw | 0.4 /100 | #288 | Tragic 28.1% |
| Canadians | 0.3 /100 | #289 | Tragic 28.1% |
| Australians | 0.3 /100 | #290 | Tragic 28.2% |
| Czechoslovakians | 0.3 /100 | #291 | Tragic 28.2% |
| Immigrants | Australia | 0.3 /100 | #292 | Tragic 28.2% |
| Immigrants | Israel | 0.3 /100 | #293 | Tragic 28.2% |
| Greeks | 0.3 /100 | #294 | Tragic 28.2% |
| Slovenes | 0.3 /100 | #295 | Tragic 28.3% |
| Northern Europeans | 0.3 /100 | #296 | Tragic 28.3% |
| Immigrants | North America | 0.2 /100 | #297 | Tragic 28.4% |
| Austrians | 0.2 /100 | #298 | Tragic 28.4% |
| Immigrants | North Macedonia | 0.2 /100 | #299 | Tragic 28.4% |