Immigrants from Eritrea vs Immigrants from Australia College, 1 year or more
COMPARE
Immigrants from Eritrea
Immigrants from Australia
College, 1 year or more
College, 1 year or more Comparison
Immigrants from Eritrea
Immigrants from Australia
60.7%
COLLEGE, 1 YEAR OR MORE
84.3/ 100
METRIC RATING
139th/ 347
METRIC RANK
67.7%
COLLEGE, 1 YEAR OR MORE
100.0/ 100
METRIC RATING
10th/ 347
METRIC RANK
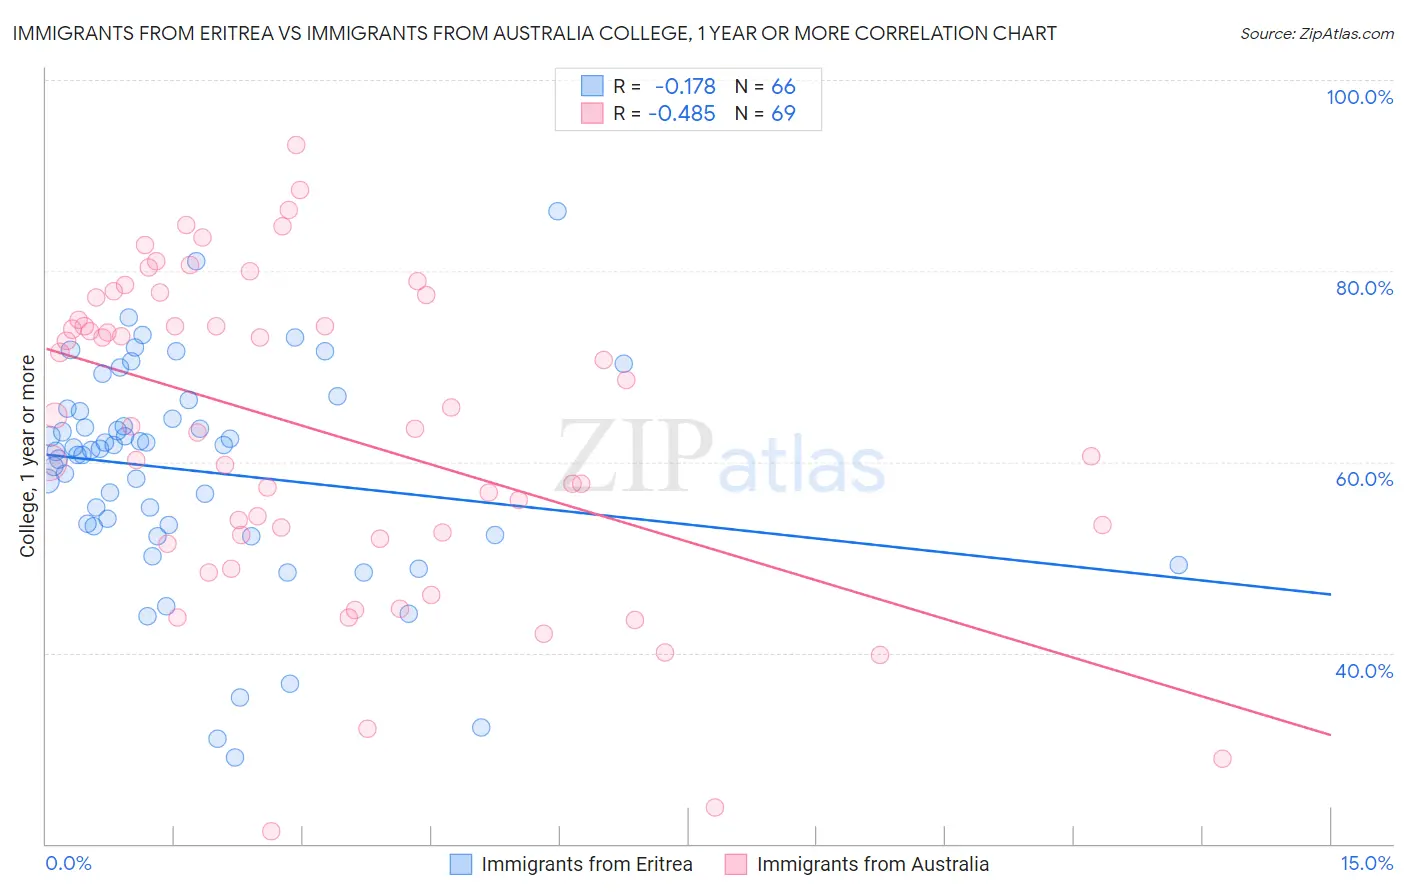
Immigrants from Eritrea vs Immigrants from Australia College, 1 year or more Correlation Chart
The statistical analysis conducted on geographies consisting of 104,852,788 people shows a poor negative correlation between the proportion of Immigrants from Eritrea and percentage of population with at least college, 1 year or more education in the United States with a correlation coefficient (R) of -0.178 and weighted average of 60.7%. Similarly, the statistical analysis conducted on geographies consisting of 227,203,602 people shows a moderate negative correlation between the proportion of Immigrants from Australia and percentage of population with at least college, 1 year or more education in the United States with a correlation coefficient (R) of -0.485 and weighted average of 67.7%, a difference of 11.4%.
College, 1 year or more Correlation Summary
| Measurement | Immigrants from Eritrea | Immigrants from Australia |
| Minimum | 29.1% | 21.4% |
| Maximum | 86.2% | 93.2% |
| Range | 57.1% | 71.9% |
| Mean | 59.0% | 63.0% |
| Median | 61.3% | 63.8% |
| Interquartile 25% (IQ1) | 53.3% | 52.1% |
| Interquartile 75% (IQ3) | 65.3% | 76.1% |
| Interquartile Range (IQR) | 12.0% | 24.0% |
| Standard Deviation (Sample) | 11.3% | 16.5% |
| Standard Deviation (Population) | 11.3% | 16.3% |
Similar Demographics by College, 1 year or more
Demographics Similar to Immigrants from Eritrea by College, 1 year or more
In terms of college, 1 year or more, the demographic groups most similar to Immigrants from Eritrea are Taiwanese (60.7%, a difference of 0.0%), Iraqi (60.7%, a difference of 0.090%), Immigrants from Afghanistan (60.7%, a difference of 0.11%), Polish (60.7%, a difference of 0.14%), and Canadian (60.6%, a difference of 0.15%).
| Demographics | Rating | Rank | College, 1 year or more |
| Scandinavians | 88.2 /100 | #132 | Excellent 61.0% |
| Immigrants | Uzbekistan | 88.0 /100 | #133 | Excellent 61.0% |
| Immigrants | Venezuela | 87.9 /100 | #134 | Excellent 61.0% |
| Immigrants | Uganda | 87.4 /100 | #135 | Excellent 60.9% |
| Basques | 87.2 /100 | #136 | Excellent 60.9% |
| Slovenes | 86.5 /100 | #137 | Excellent 60.9% |
| Taiwanese | 84.3 /100 | #138 | Excellent 60.7% |
| Immigrants | Eritrea | 84.3 /100 | #139 | Excellent 60.7% |
| Iraqis | 83.3 /100 | #140 | Excellent 60.7% |
| Immigrants | Afghanistan | 83.1 /100 | #141 | Excellent 60.7% |
| Poles | 82.8 /100 | #142 | Excellent 60.7% |
| Canadians | 82.7 /100 | #143 | Excellent 60.6% |
| Czechs | 81.9 /100 | #144 | Excellent 60.6% |
| Slavs | 81.1 /100 | #145 | Excellent 60.6% |
| Scottish | 80.2 /100 | #146 | Excellent 60.5% |
Demographics Similar to Immigrants from Australia by College, 1 year or more
In terms of college, 1 year or more, the demographic groups most similar to Immigrants from Australia are Immigrants from Israel (67.8%, a difference of 0.22%), Immigrants from South Central Asia (67.1%, a difference of 0.77%), Cypriot (67.0%, a difference of 0.94%), Immigrants from Sweden (66.8%, a difference of 1.3%), and Thai (68.6%, a difference of 1.4%).
| Demographics | Rating | Rank | College, 1 year or more |
| Iranians | 100.0 /100 | #3 | Exceptional 70.0% |
| Immigrants | Taiwan | 100.0 /100 | #4 | Exceptional 69.6% |
| Immigrants | India | 100.0 /100 | #5 | Exceptional 69.6% |
| Immigrants | Iran | 100.0 /100 | #6 | Exceptional 69.5% |
| Okinawans | 100.0 /100 | #7 | Exceptional 69.0% |
| Thais | 100.0 /100 | #8 | Exceptional 68.6% |
| Immigrants | Israel | 100.0 /100 | #9 | Exceptional 67.8% |
| Immigrants | Australia | 100.0 /100 | #10 | Exceptional 67.7% |
| Immigrants | South Central Asia | 100.0 /100 | #11 | Exceptional 67.1% |
| Cypriots | 100.0 /100 | #12 | Exceptional 67.0% |
| Immigrants | Sweden | 100.0 /100 | #13 | Exceptional 66.8% |
| Burmese | 100.0 /100 | #14 | Exceptional 66.7% |
| Cambodians | 100.0 /100 | #15 | Exceptional 66.7% |
| Immigrants | Japan | 100.0 /100 | #16 | Exceptional 66.7% |
| Immigrants | Eastern Asia | 100.0 /100 | #17 | Exceptional 66.6% |