Immigrants from Chile vs African 5th Grade
COMPARE
Immigrants from Chile
African
5th Grade
5th Grade Comparison
Immigrants from Chile
Africans
97.2%
5TH GRADE
16.6/ 100
METRIC RATING
201st/ 347
METRIC RANK
97.2%
5TH GRADE
15.3/ 100
METRIC RATING
202nd/ 347
METRIC RANK
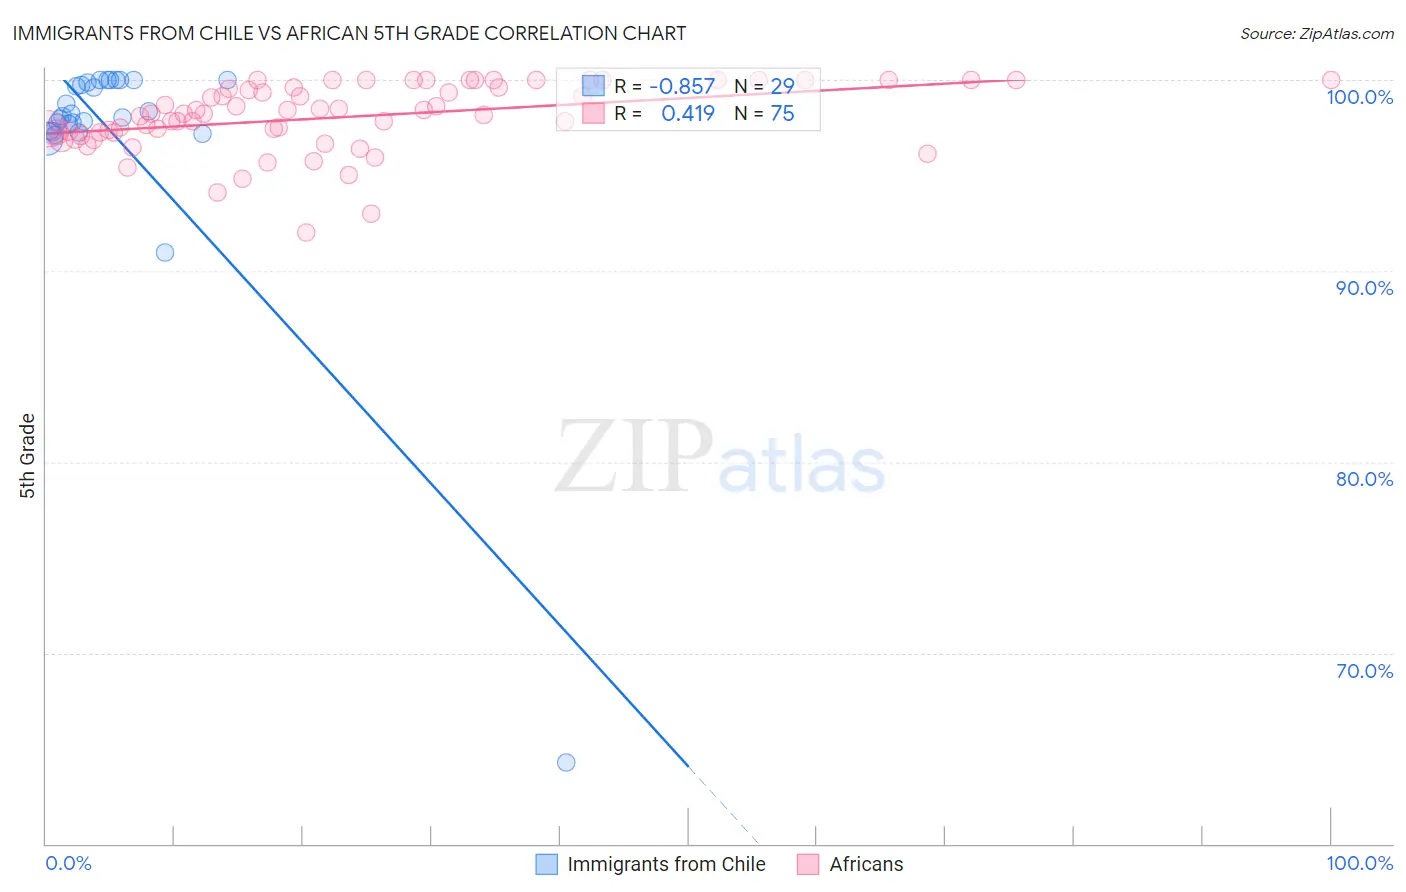
Immigrants from Chile vs African 5th Grade Correlation Chart
The statistical analysis conducted on geographies consisting of 218,647,266 people shows a very strong negative correlation between the proportion of Immigrants from Chile and percentage of population with at least 5th grade education in the United States with a correlation coefficient (R) of -0.857 and weighted average of 97.2%. Similarly, the statistical analysis conducted on geographies consisting of 470,094,744 people shows a moderate positive correlation between the proportion of Africans and percentage of population with at least 5th grade education in the United States with a correlation coefficient (R) of 0.419 and weighted average of 97.2%, a difference of 0.010%.
5th Grade Correlation Summary
| Measurement | Immigrants from Chile | African |
| Minimum | 64.3% | 92.0% |
| Maximum | 100.0% | 100.0% |
| Range | 35.7% | 8.0% |
| Mean | 97.2% | 98.1% |
| Median | 98.1% | 98.2% |
| Interquartile 25% (IQ1) | 97.3% | 97.2% |
| Interquartile 75% (IQ3) | 99.9% | 99.6% |
| Interquartile Range (IQR) | 2.6% | 2.4% |
| Standard Deviation (Sample) | 6.6% | 1.8% |
| Standard Deviation (Population) | 6.5% | 1.8% |
Demographics Similar to Immigrants from Chile and Africans by 5th Grade
In terms of 5th grade, the demographic groups most similar to Immigrants from Chile are Immigrants from Northern Africa (97.2%, a difference of 0.0%), Native/Alaskan (97.2%, a difference of 0.010%), Immigrants from Bahamas (97.2%, a difference of 0.010%), Immigrants from Zaire (97.1%, a difference of 0.020%), and Immigrants from Uganda (97.2%, a difference of 0.030%). Similarly, the demographic groups most similar to Africans are Immigrants from Bahamas (97.2%, a difference of 0.0%), Immigrants from Northern Africa (97.2%, a difference of 0.010%), Immigrants from Zaire (97.1%, a difference of 0.010%), Native/Alaskan (97.2%, a difference of 0.020%), and Moroccan (97.1%, a difference of 0.030%).
| Demographics | Rating | Rank | 5th Grade |
| Immigrants | Brazil | 31.5 /100 | #191 | Fair 97.3% |
| Panamanians | 31.3 /100 | #192 | Fair 97.3% |
| Navajo | 29.0 /100 | #193 | Fair 97.2% |
| Immigrants | Albania | 28.5 /100 | #194 | Fair 97.2% |
| Guamanians/Chamorros | 26.8 /100 | #195 | Fair 97.2% |
| Hawaiians | 25.6 /100 | #196 | Fair 97.2% |
| Brazilians | 25.4 /100 | #197 | Fair 97.2% |
| Immigrants | Uganda | 21.1 /100 | #198 | Fair 97.2% |
| Natives/Alaskans | 18.0 /100 | #199 | Poor 97.2% |
| Immigrants | Northern Africa | 16.8 /100 | #200 | Poor 97.2% |
| Immigrants | Chile | 16.6 /100 | #201 | Poor 97.2% |
| Africans | 15.3 /100 | #202 | Poor 97.2% |
| Immigrants | Bahamas | 14.9 /100 | #203 | Poor 97.2% |
| Immigrants | Zaire | 13.7 /100 | #204 | Poor 97.1% |
| Moroccans | 12.0 /100 | #205 | Poor 97.1% |
| Paiute | 11.6 /100 | #206 | Poor 97.1% |
| Iraqis | 10.9 /100 | #207 | Poor 97.1% |
| Laotians | 10.8 /100 | #208 | Poor 97.1% |
| Immigrants | Nepal | 10.3 /100 | #209 | Poor 97.1% |
| Immigrants | Oceania | 10.0 /100 | #210 | Poor 97.1% |
| Samoans | 8.5 /100 | #211 | Tragic 97.1% |