Immigrants from Bahamas vs Immigrants from Ecuador Wage/Income Gap
COMPARE
Immigrants from Bahamas
Immigrants from Ecuador
Wage/Income Gap
Wage/Income Gap Comparison
Immigrants from Bahamas
Immigrants from Ecuador
21.1%
WAGE/INCOME GAP
100.0/ 100
METRIC RATING
33rd/ 347
METRIC RANK
22.5%
WAGE/INCOME GAP
100.0/ 100
METRIC RATING
63rd/ 347
METRIC RANK
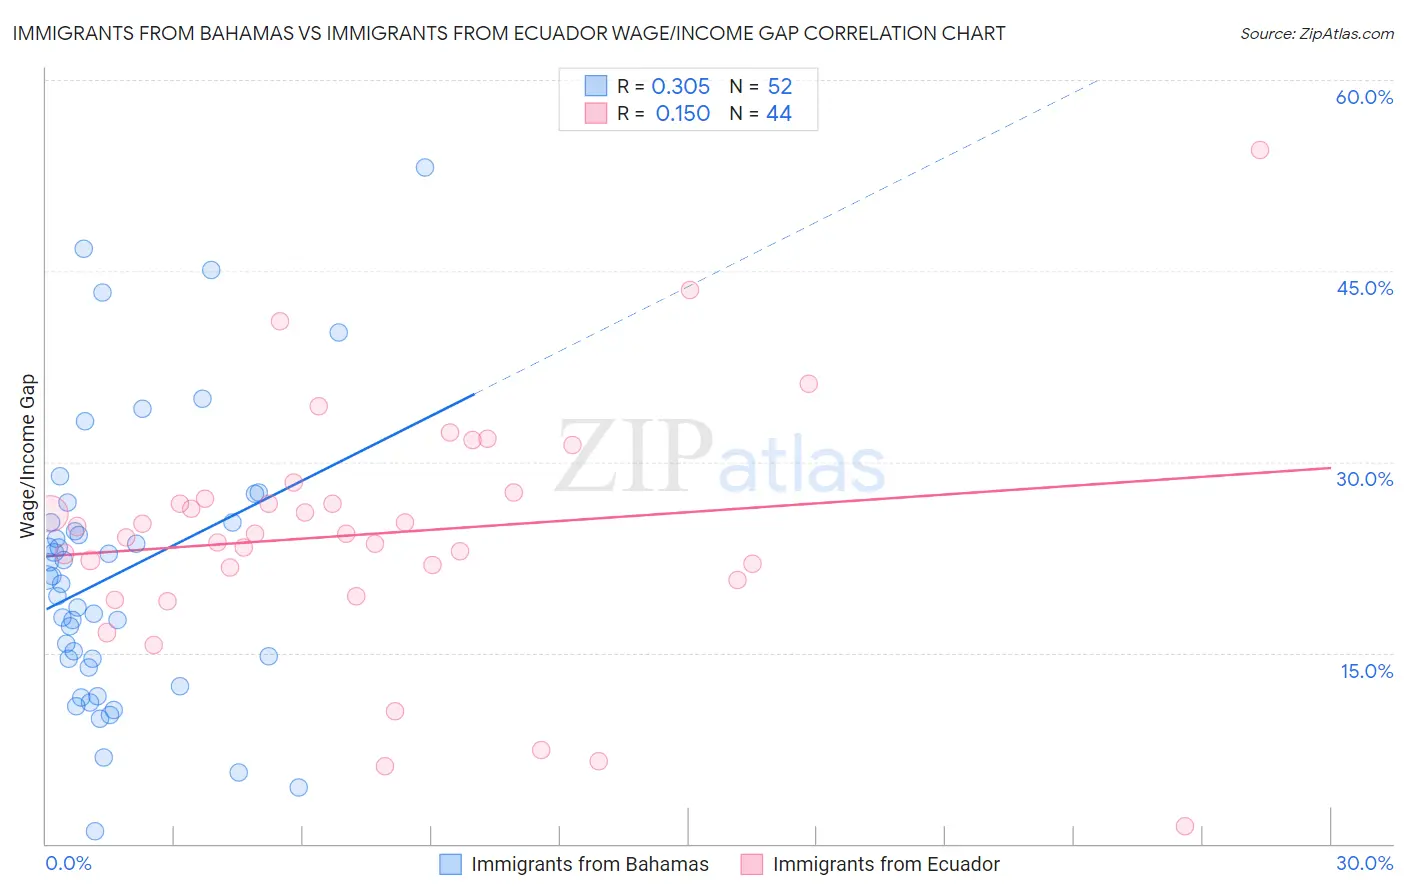
Immigrants from Bahamas vs Immigrants from Ecuador Wage/Income Gap Correlation Chart
The statistical analysis conducted on geographies consisting of 104,631,049 people shows a mild positive correlation between the proportion of Immigrants from Bahamas and wage/income gap percentage in the United States with a correlation coefficient (R) of 0.305 and weighted average of 21.1%. Similarly, the statistical analysis conducted on geographies consisting of 270,894,682 people shows a poor positive correlation between the proportion of Immigrants from Ecuador and wage/income gap percentage in the United States with a correlation coefficient (R) of 0.150 and weighted average of 22.5%, a difference of 6.8%.
Wage/Income Gap Correlation Summary
| Measurement | Immigrants from Bahamas | Immigrants from Ecuador |
| Minimum | 0.96% | 1.4% |
| Maximum | 53.2% | 54.5% |
| Range | 52.2% | 53.1% |
| Mean | 21.3% | 24.4% |
| Median | 20.7% | 24.4% |
| Interquartile 25% (IQ1) | 14.2% | 21.2% |
| Interquartile 75% (IQ3) | 25.2% | 27.3% |
| Interquartile Range (IQR) | 11.1% | 6.1% |
| Standard Deviation (Sample) | 11.0% | 9.6% |
| Standard Deviation (Population) | 10.9% | 9.5% |
Similar Demographics by Wage/Income Gap
Demographics Similar to Immigrants from Bahamas by Wage/Income Gap
In terms of wage/income gap, the demographic groups most similar to Immigrants from Bahamas are Immigrants from Yemen (21.1%, a difference of 0.010%), Vietnamese (21.0%, a difference of 0.25%), Pima (21.1%, a difference of 0.28%), Immigrants from Bangladesh (20.9%, a difference of 0.53%), and Immigrants from Senegal (20.9%, a difference of 0.74%).
| Demographics | Rating | Rank | Wage/Income Gap |
| Pueblo | 100.0 /100 | #26 | Exceptional 20.7% |
| Immigrants | Armenia | 100.0 /100 | #27 | Exceptional 20.7% |
| Inupiat | 100.0 /100 | #28 | Exceptional 20.8% |
| Immigrants | Senegal | 100.0 /100 | #29 | Exceptional 20.9% |
| Immigrants | Bangladesh | 100.0 /100 | #30 | Exceptional 20.9% |
| Vietnamese | 100.0 /100 | #31 | Exceptional 21.0% |
| Immigrants | Yemen | 100.0 /100 | #32 | Exceptional 21.1% |
| Immigrants | Bahamas | 100.0 /100 | #33 | Exceptional 21.1% |
| Pima | 100.0 /100 | #34 | Exceptional 21.1% |
| Somalis | 100.0 /100 | #35 | Exceptional 21.2% |
| Belizeans | 100.0 /100 | #36 | Exceptional 21.2% |
| Immigrants | Somalia | 100.0 /100 | #37 | Exceptional 21.2% |
| Immigrants | Belize | 100.0 /100 | #38 | Exceptional 21.3% |
| Colville | 100.0 /100 | #39 | Exceptional 21.3% |
| Lumbee | 100.0 /100 | #40 | Exceptional 21.3% |
Demographics Similar to Immigrants from Ecuador by Wage/Income Gap
In terms of wage/income gap, the demographic groups most similar to Immigrants from Ecuador are Immigrants from Guatemala (22.5%, a difference of 0.14%), Spanish American Indian (22.5%, a difference of 0.29%), Immigrants from Fiji (22.4%, a difference of 0.35%), Immigrants from Middle Africa (22.4%, a difference of 0.52%), and Navajo (22.4%, a difference of 0.54%).
| Demographics | Rating | Rank | Wage/Income Gap |
| Immigrants | Ghana | 100.0 /100 | #56 | Exceptional 22.3% |
| Ghanaians | 100.0 /100 | #57 | Exceptional 22.3% |
| Immigrants | Cuba | 100.0 /100 | #58 | Exceptional 22.4% |
| Navajo | 100.0 /100 | #59 | Exceptional 22.4% |
| Immigrants | Middle Africa | 100.0 /100 | #60 | Exceptional 22.4% |
| Immigrants | Fiji | 100.0 /100 | #61 | Exceptional 22.4% |
| Immigrants | Guatemala | 100.0 /100 | #62 | Exceptional 22.5% |
| Immigrants | Ecuador | 100.0 /100 | #63 | Exceptional 22.5% |
| Spanish American Indians | 100.0 /100 | #64 | Exceptional 22.5% |
| Guatemalans | 99.9 /100 | #65 | Exceptional 22.6% |
| Central American Indians | 99.9 /100 | #66 | Exceptional 22.7% |
| Menominee | 99.9 /100 | #67 | Exceptional 22.7% |
| Immigrants | Nigeria | 99.9 /100 | #68 | Exceptional 22.7% |
| Indonesians | 99.9 /100 | #69 | Exceptional 22.7% |
| Immigrants | Uzbekistan | 99.9 /100 | #70 | Exceptional 22.7% |