Irish vs Bhutanese Householder Income Over 65 years
COMPARE
Irish
Bhutanese
Householder Income Over 65 years
Householder Income Over 65 years Comparison
Irish
Bhutanese
$61,097
HOUSEHOLDER INCOME OVER 65 YEARS
53.4/ 100
METRIC RATING
168th/ 347
METRIC RANK
$72,288
HOUSEHOLDER INCOME OVER 65 YEARS
100.0/ 100
METRIC RATING
10th/ 347
METRIC RANK
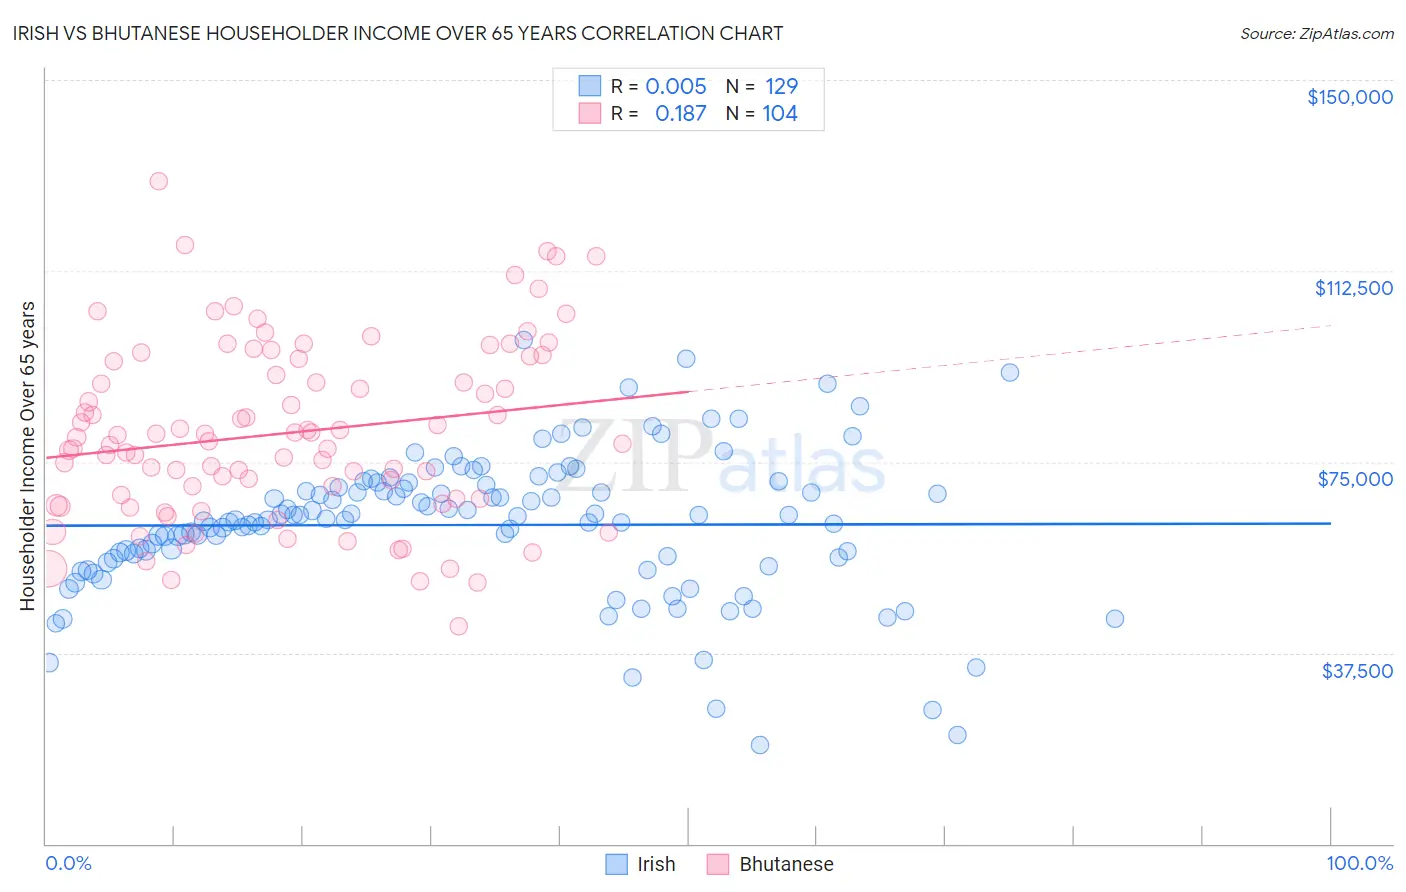
Irish vs Bhutanese Householder Income Over 65 years Correlation Chart
The statistical analysis conducted on geographies consisting of 573,728,023 people shows no correlation between the proportion of Irish and household income with householder over the age of 65 in the United States with a correlation coefficient (R) of 0.005 and weighted average of $61,097. Similarly, the statistical analysis conducted on geographies consisting of 453,217,193 people shows a poor positive correlation between the proportion of Bhutanese and household income with householder over the age of 65 in the United States with a correlation coefficient (R) of 0.187 and weighted average of $72,288, a difference of 18.3%.
Householder Income Over 65 years Correlation Summary
| Measurement | Irish | Bhutanese |
| Minimum | $19,395 | $42,695 |
| Maximum | $98,930 | $130,207 |
| Range | $79,535 | $87,512 |
| Mean | $62,615 | $80,718 |
| Median | $63,596 | $79,378 |
| Interquartile 25% (IQ1) | $56,098 | $67,810 |
| Interquartile 75% (IQ3) | $70,177 | $95,004 |
| Interquartile Range (IQR) | $14,079 | $27,195 |
| Standard Deviation (Sample) | $14,074 | $17,380 |
| Standard Deviation (Population) | $14,019 | $17,296 |
Similar Demographics by Householder Income Over 65 years
Demographics Similar to Irish by Householder Income Over 65 years
In terms of householder income over 65 years, the demographic groups most similar to Irish are Norwegian ($61,104, a difference of 0.010%), Carpatho Rusyn ($61,093, a difference of 0.010%), Serbian ($61,087, a difference of 0.020%), Inupiat ($61,061, a difference of 0.060%), and Immigrants from Poland ($61,041, a difference of 0.090%).
| Demographics | Rating | Rank | Householder Income Over 65 years |
| Icelanders | 57.9 /100 | #161 | Average $61,270 |
| Czechs | 57.2 /100 | #162 | Average $61,244 |
| Ugandans | 55.5 /100 | #163 | Average $61,177 |
| Immigrants | North Macedonia | 55.4 /100 | #164 | Average $61,175 |
| Immigrants | Ukraine | 55.1 /100 | #165 | Average $61,163 |
| Immigrants | Eastern Africa | 55.0 /100 | #166 | Average $61,157 |
| Norwegians | 53.6 /100 | #167 | Average $61,104 |
| Irish | 53.4 /100 | #168 | Average $61,097 |
| Carpatho Rusyns | 53.3 /100 | #169 | Average $61,093 |
| Serbians | 53.1 /100 | #170 | Average $61,087 |
| Inupiat | 52.4 /100 | #171 | Average $61,061 |
| Immigrants | Poland | 51.9 /100 | #172 | Average $61,041 |
| Immigrants | Micronesia | 50.8 /100 | #173 | Average $61,000 |
| Luxembourgers | 50.0 /100 | #174 | Average $60,967 |
| Spaniards | 47.3 /100 | #175 | Average $60,866 |
Demographics Similar to Bhutanese by Householder Income Over 65 years
In terms of householder income over 65 years, the demographic groups most similar to Bhutanese are Thai ($72,099, a difference of 0.26%), Immigrants from India ($72,804, a difference of 0.71%), Cypriot ($71,714, a difference of 0.80%), Immigrants from Singapore ($72,963, a difference of 0.93%), and Immigrants from Hong Kong ($71,567, a difference of 1.0%).
| Demographics | Rating | Rank | Householder Income Over 65 years |
| Immigrants | Taiwan | 100.0 /100 | #3 | Exceptional $77,051 |
| Filipinos | 100.0 /100 | #4 | Exceptional $76,686 |
| Immigrants | Iran | 100.0 /100 | #5 | Exceptional $75,081 |
| Bolivians | 100.0 /100 | #6 | Exceptional $74,245 |
| Immigrants | Bolivia | 100.0 /100 | #7 | Exceptional $73,434 |
| Immigrants | Singapore | 100.0 /100 | #8 | Exceptional $72,963 |
| Immigrants | India | 100.0 /100 | #9 | Exceptional $72,804 |
| Bhutanese | 100.0 /100 | #10 | Exceptional $72,288 |
| Thais | 100.0 /100 | #11 | Exceptional $72,099 |
| Cypriots | 100.0 /100 | #12 | Exceptional $71,714 |
| Immigrants | Hong Kong | 100.0 /100 | #13 | Exceptional $71,567 |
| Burmese | 100.0 /100 | #14 | Exceptional $71,139 |
| Native Hawaiians | 100.0 /100 | #15 | Exceptional $71,021 |
| Okinawans | 100.0 /100 | #16 | Exceptional $70,846 |
| Immigrants | Korea | 100.0 /100 | #17 | Exceptional $70,696 |