Immigrants from Iraq vs Bhutanese Householder Income Over 65 years
COMPARE
Immigrants from Iraq
Bhutanese
Householder Income Over 65 years
Householder Income Over 65 years Comparison
Immigrants from Iraq
Bhutanese
$59,824
HOUSEHOLDER INCOME OVER 65 YEARS
23.2/ 100
METRIC RATING
195th/ 347
METRIC RANK
$72,288
HOUSEHOLDER INCOME OVER 65 YEARS
100.0/ 100
METRIC RATING
10th/ 347
METRIC RANK
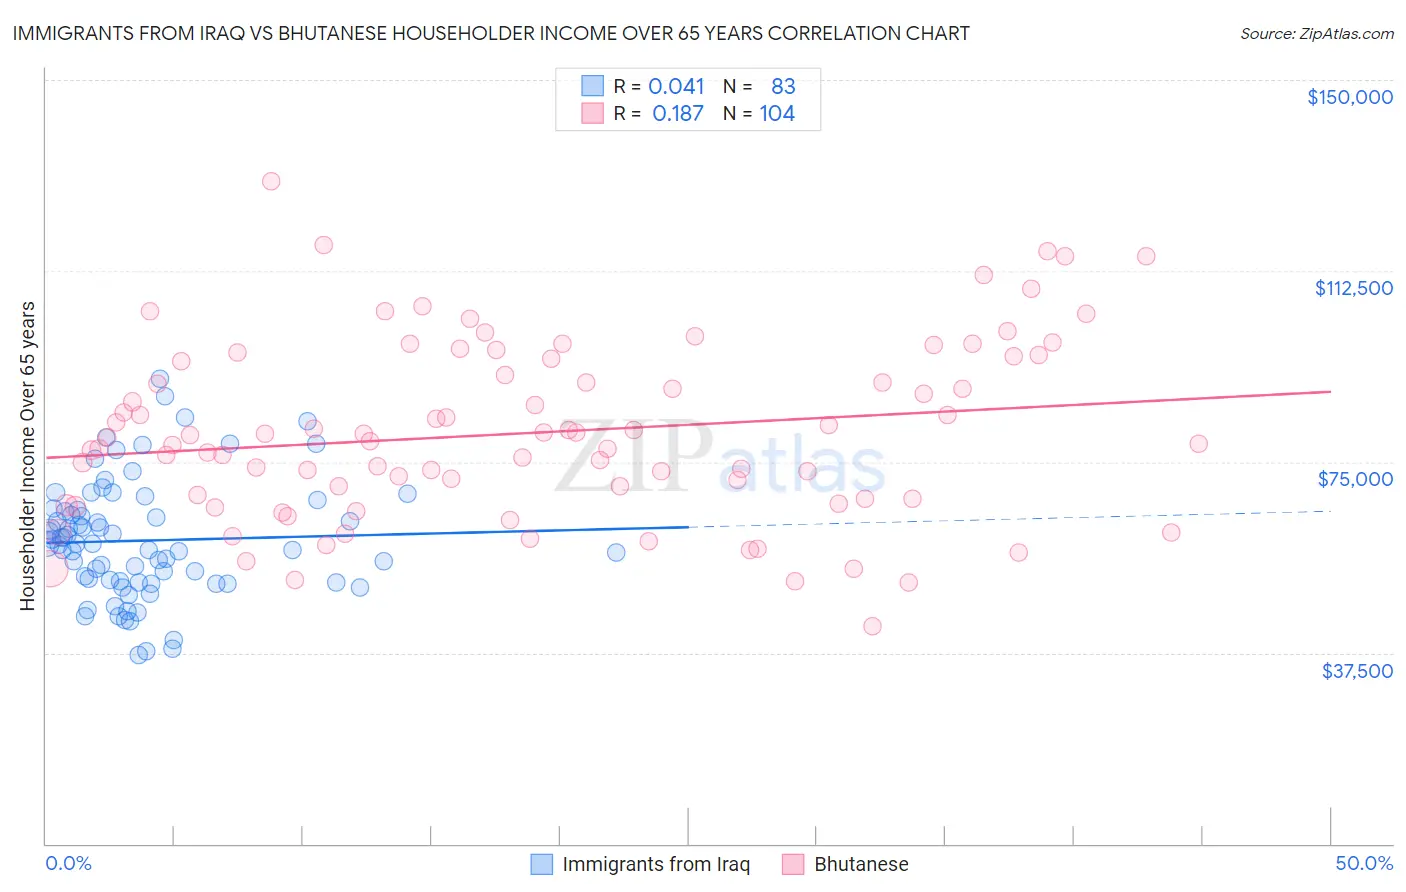
Immigrants from Iraq vs Bhutanese Householder Income Over 65 years Correlation Chart
The statistical analysis conducted on geographies consisting of 194,612,135 people shows no correlation between the proportion of Immigrants from Iraq and household income with householder over the age of 65 in the United States with a correlation coefficient (R) of 0.041 and weighted average of $59,824. Similarly, the statistical analysis conducted on geographies consisting of 453,217,193 people shows a poor positive correlation between the proportion of Bhutanese and household income with householder over the age of 65 in the United States with a correlation coefficient (R) of 0.187 and weighted average of $72,288, a difference of 20.8%.
Householder Income Over 65 years Correlation Summary
| Measurement | Immigrants from Iraq | Bhutanese |
| Minimum | $37,148 | $42,695 |
| Maximum | $91,250 | $130,207 |
| Range | $54,102 | $87,512 |
| Mean | $59,538 | $80,718 |
| Median | $58,855 | $79,378 |
| Interquartile 25% (IQ1) | $51,355 | $67,810 |
| Interquartile 75% (IQ3) | $65,529 | $95,004 |
| Interquartile Range (IQR) | $14,174 | $27,195 |
| Standard Deviation (Sample) | $11,528 | $17,380 |
| Standard Deviation (Population) | $11,458 | $17,296 |
Similar Demographics by Householder Income Over 65 years
Demographics Similar to Immigrants from Iraq by Householder Income Over 65 years
In terms of householder income over 65 years, the demographic groups most similar to Immigrants from Iraq are Immigrants from Africa ($59,837, a difference of 0.020%), Immigrants from Costa Rica ($59,848, a difference of 0.040%), South American ($59,854, a difference of 0.050%), Belgian ($59,915, a difference of 0.15%), and German ($59,730, a difference of 0.16%).
| Demographics | Rating | Rank | Householder Income Over 65 years |
| Immigrants | Eritrea | 28.6 /100 | #188 | Fair $60,096 |
| Ghanaians | 27.5 /100 | #189 | Fair $60,043 |
| Puget Sound Salish | 25.3 /100 | #190 | Fair $59,934 |
| Belgians | 24.9 /100 | #191 | Fair $59,915 |
| South Americans | 23.8 /100 | #192 | Fair $59,854 |
| Immigrants | Costa Rica | 23.6 /100 | #193 | Fair $59,848 |
| Immigrants | Africa | 23.4 /100 | #194 | Fair $59,837 |
| Immigrants | Iraq | 23.2 /100 | #195 | Fair $59,824 |
| Germans | 21.5 /100 | #196 | Fair $59,730 |
| Immigrants | Kenya | 21.1 /100 | #197 | Fair $59,710 |
| Moroccans | 20.7 /100 | #198 | Fair $59,683 |
| Immigrants | Immigrants | 20.2 /100 | #199 | Fair $59,656 |
| French | 20.2 /100 | #200 | Fair $59,656 |
| Dutch | 18.3 /100 | #201 | Poor $59,539 |
| Finns | 18.2 /100 | #202 | Poor $59,535 |
Demographics Similar to Bhutanese by Householder Income Over 65 years
In terms of householder income over 65 years, the demographic groups most similar to Bhutanese are Thai ($72,099, a difference of 0.26%), Immigrants from India ($72,804, a difference of 0.71%), Cypriot ($71,714, a difference of 0.80%), Immigrants from Singapore ($72,963, a difference of 0.93%), and Immigrants from Hong Kong ($71,567, a difference of 1.0%).
| Demographics | Rating | Rank | Householder Income Over 65 years |
| Immigrants | Taiwan | 100.0 /100 | #3 | Exceptional $77,051 |
| Filipinos | 100.0 /100 | #4 | Exceptional $76,686 |
| Immigrants | Iran | 100.0 /100 | #5 | Exceptional $75,081 |
| Bolivians | 100.0 /100 | #6 | Exceptional $74,245 |
| Immigrants | Bolivia | 100.0 /100 | #7 | Exceptional $73,434 |
| Immigrants | Singapore | 100.0 /100 | #8 | Exceptional $72,963 |
| Immigrants | India | 100.0 /100 | #9 | Exceptional $72,804 |
| Bhutanese | 100.0 /100 | #10 | Exceptional $72,288 |
| Thais | 100.0 /100 | #11 | Exceptional $72,099 |
| Cypriots | 100.0 /100 | #12 | Exceptional $71,714 |
| Immigrants | Hong Kong | 100.0 /100 | #13 | Exceptional $71,567 |
| Burmese | 100.0 /100 | #14 | Exceptional $71,139 |
| Native Hawaiians | 100.0 /100 | #15 | Exceptional $71,021 |
| Okinawans | 100.0 /100 | #16 | Exceptional $70,846 |
| Immigrants | Korea | 100.0 /100 | #17 | Exceptional $70,696 |