Ethiopian vs Immigrants from Mexico Median Household Income
COMPARE
Ethiopian
Immigrants from Mexico
Median Household Income
Median Household Income Comparison
Ethiopians
Immigrants from Mexico
$89,640
MEDIAN HOUSEHOLD INCOME
94.9/ 100
METRIC RATING
121st/ 347
METRIC RANK
$73,160
MEDIAN HOUSEHOLD INCOME
0.0/ 100
METRIC RATING
297th/ 347
METRIC RANK
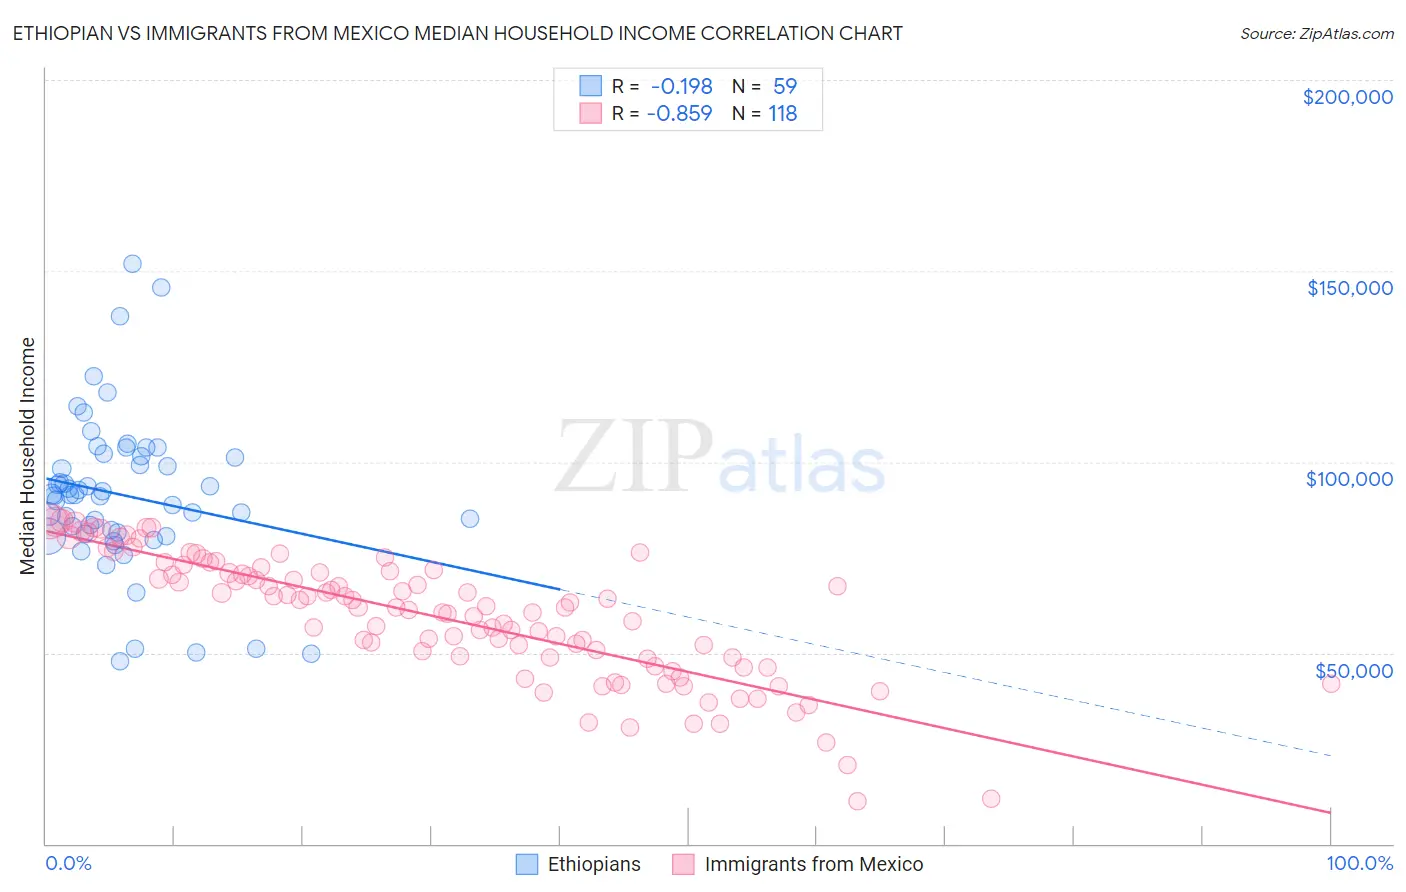
Ethiopian vs Immigrants from Mexico Median Household Income Correlation Chart
The statistical analysis conducted on geographies consisting of 223,045,474 people shows a poor negative correlation between the proportion of Ethiopians and median household income in the United States with a correlation coefficient (R) of -0.198 and weighted average of $89,640. Similarly, the statistical analysis conducted on geographies consisting of 513,131,801 people shows a very strong negative correlation between the proportion of Immigrants from Mexico and median household income in the United States with a correlation coefficient (R) of -0.859 and weighted average of $73,160, a difference of 22.5%.
Median Household Income Correlation Summary
| Measurement | Ethiopian | Immigrants from Mexico |
| Minimum | $47,668 | $11,125 |
| Maximum | $151,943 | $84,609 |
| Range | $104,275 | $73,484 |
| Mean | $91,215 | $59,423 |
| Median | $91,248 | $61,801 |
| Interquartile 25% (IQ1) | $81,124 | $48,735 |
| Interquartile 75% (IQ3) | $101,374 | $71,471 |
| Interquartile Range (IQR) | $20,250 | $22,736 |
| Standard Deviation (Sample) | $20,515 | $16,352 |
| Standard Deviation (Population) | $20,340 | $16,282 |
Similar Demographics by Median Household Income
Demographics Similar to Ethiopians by Median Household Income
In terms of median household income, the demographic groups most similar to Ethiopians are Pakistani ($89,638, a difference of 0.0%), Immigrants from North Macedonia ($89,741, a difference of 0.11%), Albanian ($89,744, a difference of 0.12%), Immigrants from Zimbabwe ($89,496, a difference of 0.16%), and Syrian ($89,830, a difference of 0.21%).
| Demographics | Rating | Rank | Median Household Income |
| Immigrants | Northern Africa | 95.9 /100 | #114 | Exceptional $90,026 |
| Immigrants | Western Asia | 95.9 /100 | #115 | Exceptional $90,005 |
| Native Hawaiians | 95.7 /100 | #116 | Exceptional $89,919 |
| Taiwanese | 95.6 /100 | #117 | Exceptional $89,900 |
| Syrians | 95.4 /100 | #118 | Exceptional $89,830 |
| Albanians | 95.2 /100 | #119 | Exceptional $89,744 |
| Immigrants | North Macedonia | 95.2 /100 | #120 | Exceptional $89,741 |
| Ethiopians | 94.9 /100 | #121 | Exceptional $89,640 |
| Pakistanis | 94.8 /100 | #122 | Exceptional $89,638 |
| Immigrants | Zimbabwe | 94.4 /100 | #123 | Exceptional $89,496 |
| Immigrants | Jordan | 94.1 /100 | #124 | Exceptional $89,412 |
| Immigrants | Kuwait | 93.5 /100 | #125 | Exceptional $89,263 |
| Immigrants | Oceania | 92.9 /100 | #126 | Exceptional $89,100 |
| Immigrants | Peru | 92.5 /100 | #127 | Exceptional $89,010 |
| Portuguese | 92.3 /100 | #128 | Exceptional $88,976 |
Demographics Similar to Immigrants from Mexico by Median Household Income
In terms of median household income, the demographic groups most similar to Immigrants from Mexico are Haitian ($73,306, a difference of 0.20%), Paiute ($72,959, a difference of 0.27%), Cuban ($73,392, a difference of 0.32%), Indonesian ($72,856, a difference of 0.42%), and Blackfeet ($73,509, a difference of 0.48%).
| Demographics | Rating | Rank | Median Household Income |
| Bangladeshis | 0.1 /100 | #290 | Tragic $74,112 |
| Hispanics or Latinos | 0.1 /100 | #291 | Tragic $73,823 |
| Comanche | 0.1 /100 | #292 | Tragic $73,747 |
| Immigrants | Cabo Verde | 0.1 /100 | #293 | Tragic $73,515 |
| Blackfeet | 0.1 /100 | #294 | Tragic $73,509 |
| Cubans | 0.1 /100 | #295 | Tragic $73,392 |
| Haitians | 0.1 /100 | #296 | Tragic $73,306 |
| Immigrants | Mexico | 0.0 /100 | #297 | Tragic $73,160 |
| Paiute | 0.0 /100 | #298 | Tragic $72,959 |
| Indonesians | 0.0 /100 | #299 | Tragic $72,856 |
| Immigrants | Dominica | 0.0 /100 | #300 | Tragic $72,760 |
| Cherokee | 0.0 /100 | #301 | Tragic $72,682 |
| Shoshone | 0.0 /100 | #302 | Tragic $72,660 |
| Africans | 0.0 /100 | #303 | Tragic $72,650 |
| Immigrants | Haiti | 0.0 /100 | #304 | Tragic $72,599 |