Ethiopian vs European Median Household Income
COMPARE
Ethiopian
European
Median Household Income
Median Household Income Comparison
Ethiopians
Europeans
$89,640
MEDIAN HOUSEHOLD INCOME
94.9/ 100
METRIC RATING
121st/ 347
METRIC RANK
$88,751
MEDIAN HOUSEHOLD INCOME
91.2/ 100
METRIC RATING
132nd/ 347
METRIC RANK
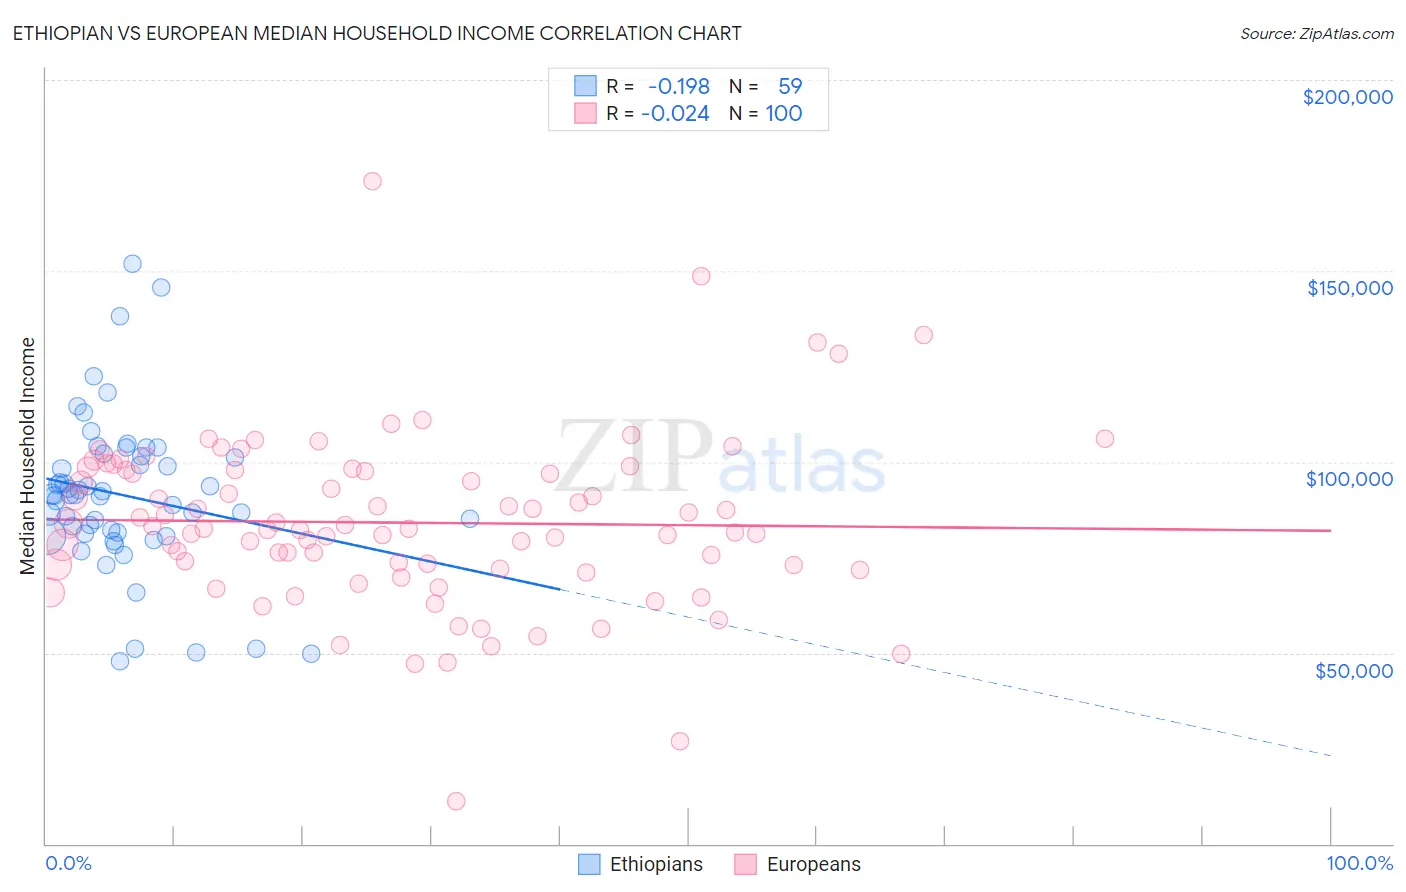
Ethiopian vs European Median Household Income Correlation Chart
The statistical analysis conducted on geographies consisting of 223,045,474 people shows a poor negative correlation between the proportion of Ethiopians and median household income in the United States with a correlation coefficient (R) of -0.198 and weighted average of $89,640. Similarly, the statistical analysis conducted on geographies consisting of 560,871,034 people shows no correlation between the proportion of Europeans and median household income in the United States with a correlation coefficient (R) of -0.024 and weighted average of $88,751, a difference of 1.0%.
Median Household Income Correlation Summary
| Measurement | Ethiopian | European |
| Minimum | $47,668 | $11,019 |
| Maximum | $151,943 | $173,396 |
| Range | $104,275 | $162,377 |
| Mean | $91,215 | $84,093 |
| Median | $91,248 | $82,550 |
| Interquartile 25% (IQ1) | $81,124 | $72,512 |
| Interquartile 75% (IQ3) | $101,374 | $97,852 |
| Interquartile Range (IQR) | $20,250 | $25,341 |
| Standard Deviation (Sample) | $20,515 | $22,686 |
| Standard Deviation (Population) | $20,340 | $22,572 |
Demographics Similar to Ethiopians and Europeans by Median Household Income
In terms of median household income, the demographic groups most similar to Ethiopians are Pakistani ($89,638, a difference of 0.0%), Immigrants from North Macedonia ($89,741, a difference of 0.11%), Albanian ($89,744, a difference of 0.12%), Immigrants from Zimbabwe ($89,496, a difference of 0.16%), and Syrian ($89,830, a difference of 0.21%). Similarly, the demographic groups most similar to Europeans are Immigrants from Syria ($88,792, a difference of 0.050%), Immigrants from Ethiopia ($88,687, a difference of 0.070%), British ($88,914, a difference of 0.18%), Brazilian ($88,934, a difference of 0.21%), and Portuguese ($88,976, a difference of 0.25%).
| Demographics | Rating | Rank | Median Household Income |
| Native Hawaiians | 95.7 /100 | #116 | Exceptional $89,919 |
| Taiwanese | 95.6 /100 | #117 | Exceptional $89,900 |
| Syrians | 95.4 /100 | #118 | Exceptional $89,830 |
| Albanians | 95.2 /100 | #119 | Exceptional $89,744 |
| Immigrants | North Macedonia | 95.2 /100 | #120 | Exceptional $89,741 |
| Ethiopians | 94.9 /100 | #121 | Exceptional $89,640 |
| Pakistanis | 94.8 /100 | #122 | Exceptional $89,638 |
| Immigrants | Zimbabwe | 94.4 /100 | #123 | Exceptional $89,496 |
| Immigrants | Jordan | 94.1 /100 | #124 | Exceptional $89,412 |
| Immigrants | Kuwait | 93.5 /100 | #125 | Exceptional $89,263 |
| Immigrants | Oceania | 92.9 /100 | #126 | Exceptional $89,100 |
| Immigrants | Peru | 92.5 /100 | #127 | Exceptional $89,010 |
| Portuguese | 92.3 /100 | #128 | Exceptional $88,976 |
| Brazilians | 92.1 /100 | #129 | Exceptional $88,934 |
| British | 92.0 /100 | #130 | Exceptional $88,914 |
| Immigrants | Syria | 91.4 /100 | #131 | Exceptional $88,792 |
| Europeans | 91.2 /100 | #132 | Exceptional $88,751 |
| Immigrants | Ethiopia | 90.9 /100 | #133 | Exceptional $88,687 |
| Swedes | 90.0 /100 | #134 | Exceptional $88,524 |
| Immigrants | Sierra Leone | 89.9 /100 | #135 | Excellent $88,498 |
| Poles | 89.7 /100 | #136 | Excellent $88,472 |