Ethiopian vs Immigrants from Denmark Median Household Income
COMPARE
Ethiopian
Immigrants from Denmark
Median Household Income
Median Household Income Comparison
Ethiopians
Immigrants from Denmark
$89,640
MEDIAN HOUSEHOLD INCOME
94.9/ 100
METRIC RATING
121st/ 347
METRIC RANK
$98,510
MEDIAN HOUSEHOLD INCOME
100.0/ 100
METRIC RATING
32nd/ 347
METRIC RANK
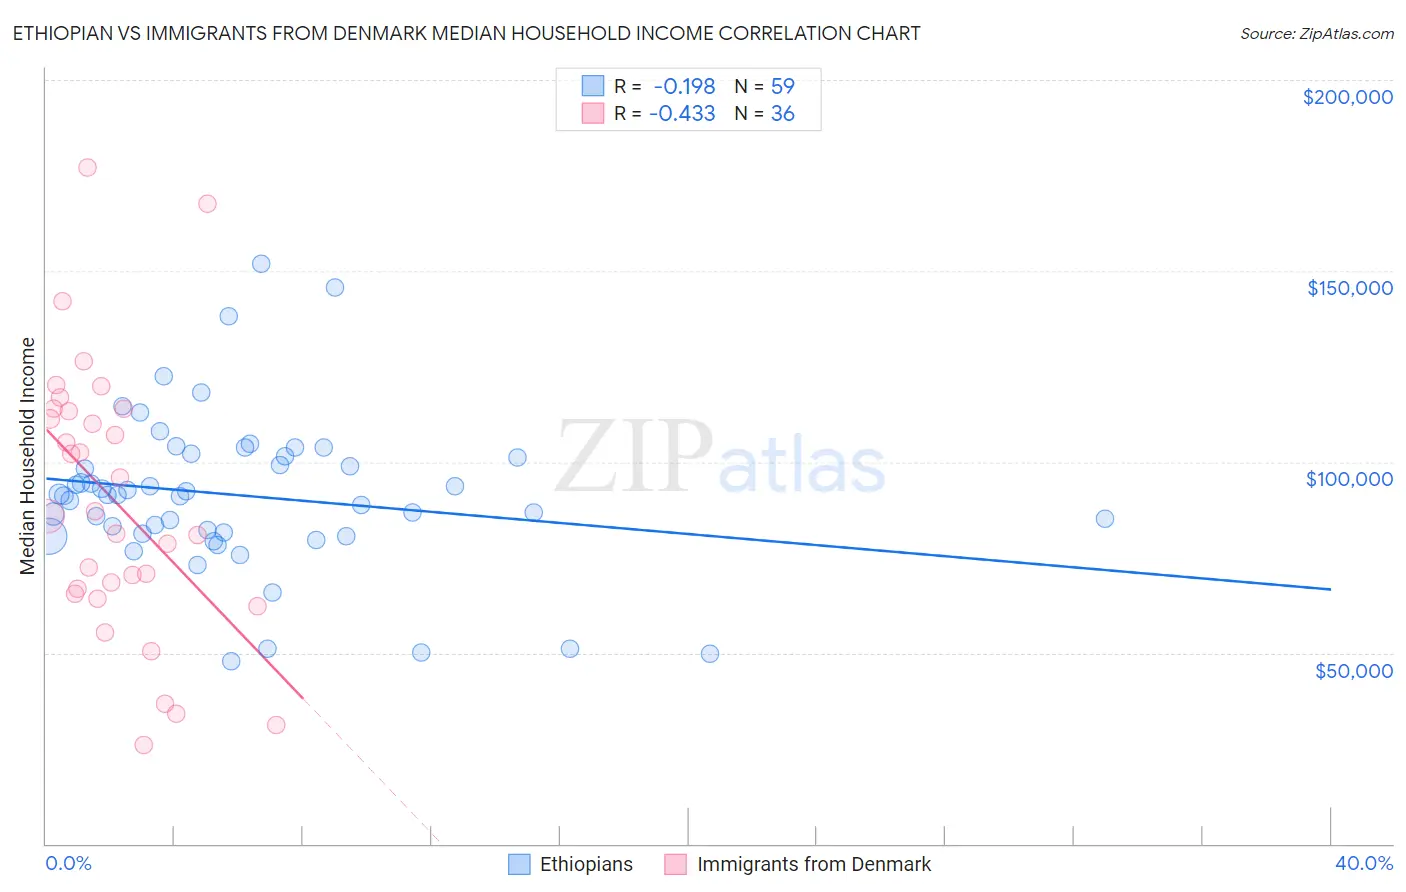
Ethiopian vs Immigrants from Denmark Median Household Income Correlation Chart
The statistical analysis conducted on geographies consisting of 223,045,474 people shows a poor negative correlation between the proportion of Ethiopians and median household income in the United States with a correlation coefficient (R) of -0.198 and weighted average of $89,640. Similarly, the statistical analysis conducted on geographies consisting of 136,400,553 people shows a moderate negative correlation between the proportion of Immigrants from Denmark and median household income in the United States with a correlation coefficient (R) of -0.433 and weighted average of $98,510, a difference of 9.9%.
Median Household Income Correlation Summary
| Measurement | Ethiopian | Immigrants from Denmark |
| Minimum | $47,668 | $26,000 |
| Maximum | $151,943 | $177,030 |
| Range | $104,275 | $151,030 |
| Mean | $91,215 | $89,771 |
| Median | $91,248 | $86,345 |
| Interquartile 25% (IQ1) | $81,124 | $66,126 |
| Interquartile 75% (IQ3) | $101,374 | $113,584 |
| Interquartile Range (IQR) | $20,250 | $47,458 |
| Standard Deviation (Sample) | $20,515 | $35,565 |
| Standard Deviation (Population) | $20,340 | $35,068 |
Similar Demographics by Median Household Income
Demographics Similar to Ethiopians by Median Household Income
In terms of median household income, the demographic groups most similar to Ethiopians are Pakistani ($89,638, a difference of 0.0%), Immigrants from North Macedonia ($89,741, a difference of 0.11%), Albanian ($89,744, a difference of 0.12%), Immigrants from Zimbabwe ($89,496, a difference of 0.16%), and Syrian ($89,830, a difference of 0.21%).
| Demographics | Rating | Rank | Median Household Income |
| Immigrants | Northern Africa | 95.9 /100 | #114 | Exceptional $90,026 |
| Immigrants | Western Asia | 95.9 /100 | #115 | Exceptional $90,005 |
| Native Hawaiians | 95.7 /100 | #116 | Exceptional $89,919 |
| Taiwanese | 95.6 /100 | #117 | Exceptional $89,900 |
| Syrians | 95.4 /100 | #118 | Exceptional $89,830 |
| Albanians | 95.2 /100 | #119 | Exceptional $89,744 |
| Immigrants | North Macedonia | 95.2 /100 | #120 | Exceptional $89,741 |
| Ethiopians | 94.9 /100 | #121 | Exceptional $89,640 |
| Pakistanis | 94.8 /100 | #122 | Exceptional $89,638 |
| Immigrants | Zimbabwe | 94.4 /100 | #123 | Exceptional $89,496 |
| Immigrants | Jordan | 94.1 /100 | #124 | Exceptional $89,412 |
| Immigrants | Kuwait | 93.5 /100 | #125 | Exceptional $89,263 |
| Immigrants | Oceania | 92.9 /100 | #126 | Exceptional $89,100 |
| Immigrants | Peru | 92.5 /100 | #127 | Exceptional $89,010 |
| Portuguese | 92.3 /100 | #128 | Exceptional $88,976 |
Demographics Similar to Immigrants from Denmark by Median Household Income
In terms of median household income, the demographic groups most similar to Immigrants from Denmark are Chinese ($98,496, a difference of 0.010%), Russian ($98,008, a difference of 0.51%), Immigrants from Switzerland ($97,979, a difference of 0.54%), Turkish ($99,389, a difference of 0.89%), and Immigrants from Pakistan ($97,528, a difference of 1.0%).
| Demographics | Rating | Rank | Median Household Income |
| Immigrants | Sweden | 100.0 /100 | #25 | Exceptional $100,699 |
| Immigrants | Belgium | 100.0 /100 | #26 | Exceptional $100,306 |
| Bhutanese | 100.0 /100 | #27 | Exceptional $100,151 |
| Immigrants | Sri Lanka | 100.0 /100 | #28 | Exceptional $99,943 |
| Immigrants | Asia | 100.0 /100 | #29 | Exceptional $99,933 |
| Immigrants | Northern Europe | 100.0 /100 | #30 | Exceptional $99,813 |
| Turks | 100.0 /100 | #31 | Exceptional $99,389 |
| Immigrants | Denmark | 100.0 /100 | #32 | Exceptional $98,510 |
| Chinese | 100.0 /100 | #33 | Exceptional $98,496 |
| Russians | 100.0 /100 | #34 | Exceptional $98,008 |
| Immigrants | Switzerland | 100.0 /100 | #35 | Exceptional $97,979 |
| Immigrants | Pakistan | 100.0 /100 | #36 | Exceptional $97,528 |
| Latvians | 100.0 /100 | #37 | Exceptional $97,311 |
| Immigrants | Indonesia | 100.0 /100 | #38 | Exceptional $97,297 |
| Afghans | 100.0 /100 | #39 | Exceptional $97,026 |