Honduran vs Immigrants from Mexico Median Household Income
COMPARE
Honduran
Immigrants from Mexico
Median Household Income
Median Household Income Comparison
Hondurans
Immigrants from Mexico
$72,588
MEDIAN HOUSEHOLD INCOME
0.0/ 100
METRIC RATING
305th/ 347
METRIC RANK
$73,160
MEDIAN HOUSEHOLD INCOME
0.0/ 100
METRIC RATING
297th/ 347
METRIC RANK
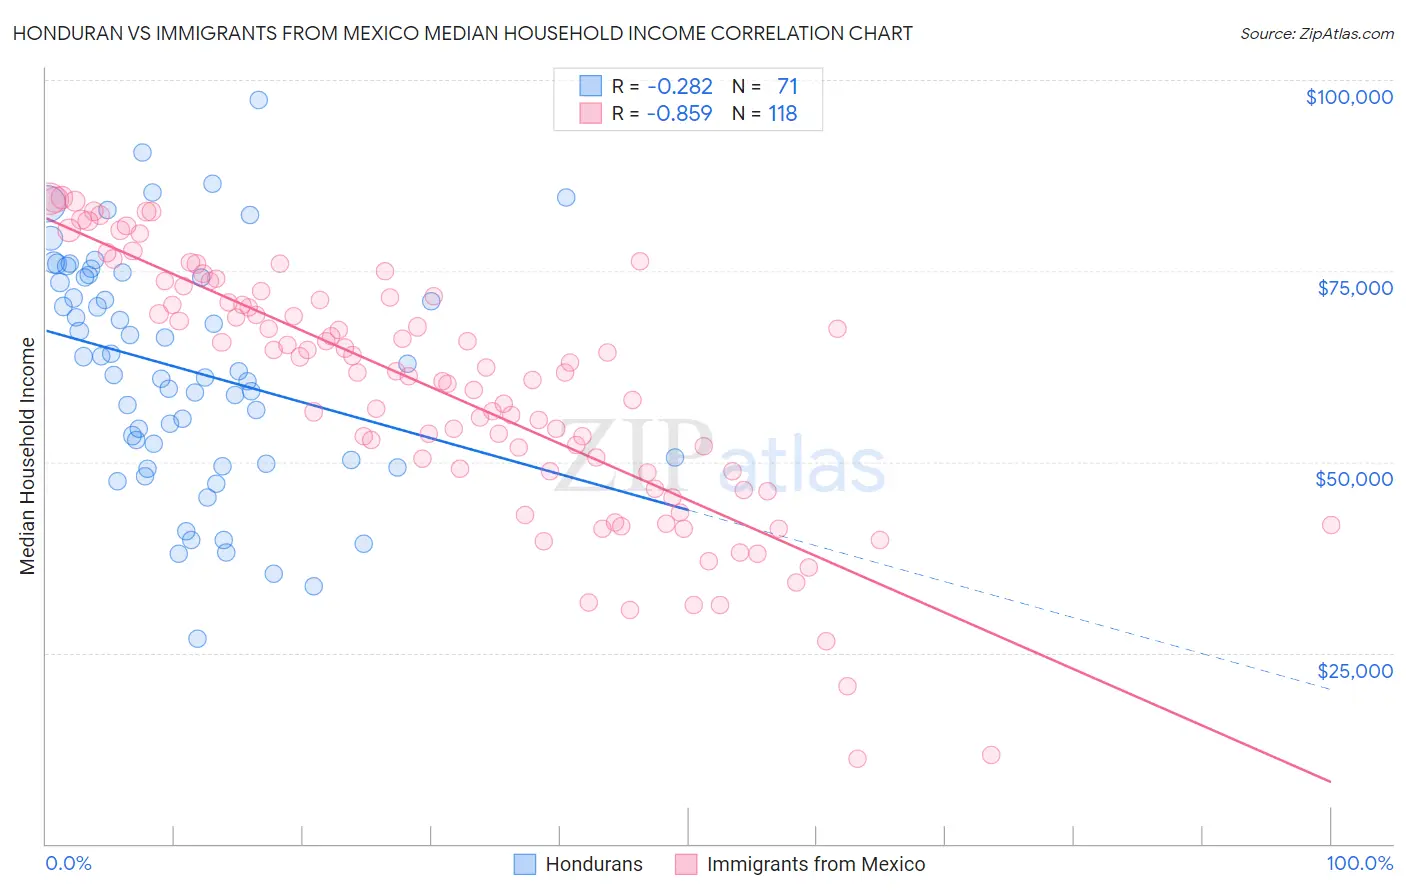
Honduran vs Immigrants from Mexico Median Household Income Correlation Chart
The statistical analysis conducted on geographies consisting of 357,531,795 people shows a weak negative correlation between the proportion of Hondurans and median household income in the United States with a correlation coefficient (R) of -0.282 and weighted average of $72,588. Similarly, the statistical analysis conducted on geographies consisting of 513,131,801 people shows a very strong negative correlation between the proportion of Immigrants from Mexico and median household income in the United States with a correlation coefficient (R) of -0.859 and weighted average of $73,160, a difference of 0.79%.
Median Household Income Correlation Summary
| Measurement | Honduran | Immigrants from Mexico |
| Minimum | $26,822 | $11,125 |
| Maximum | $97,304 | $84,609 |
| Range | $70,482 | $73,484 |
| Mean | $62,141 | $59,423 |
| Median | $61,786 | $61,801 |
| Interquartile 25% (IQ1) | $50,302 | $48,735 |
| Interquartile 75% (IQ3) | $74,115 | $71,471 |
| Interquartile Range (IQR) | $23,813 | $22,736 |
| Standard Deviation (Sample) | $15,104 | $16,352 |
| Standard Deviation (Population) | $14,997 | $16,282 |
Demographics Similar to Hondurans and Immigrants from Mexico by Median Household Income
In terms of median household income, the demographic groups most similar to Hondurans are Immigrants from Haiti ($72,599, a difference of 0.020%), Potawatomi ($72,576, a difference of 0.020%), African ($72,650, a difference of 0.090%), Shoshone ($72,660, a difference of 0.10%), and Cherokee ($72,682, a difference of 0.13%). Similarly, the demographic groups most similar to Immigrants from Mexico are Haitian ($73,306, a difference of 0.20%), Paiute ($72,959, a difference of 0.27%), Cuban ($73,392, a difference of 0.32%), Indonesian ($72,856, a difference of 0.42%), and Blackfeet ($73,509, a difference of 0.48%).
| Demographics | Rating | Rank | Median Household Income |
| Hispanics or Latinos | 0.1 /100 | #291 | Tragic $73,823 |
| Comanche | 0.1 /100 | #292 | Tragic $73,747 |
| Immigrants | Cabo Verde | 0.1 /100 | #293 | Tragic $73,515 |
| Blackfeet | 0.1 /100 | #294 | Tragic $73,509 |
| Cubans | 0.1 /100 | #295 | Tragic $73,392 |
| Haitians | 0.1 /100 | #296 | Tragic $73,306 |
| Immigrants | Mexico | 0.0 /100 | #297 | Tragic $73,160 |
| Paiute | 0.0 /100 | #298 | Tragic $72,959 |
| Indonesians | 0.0 /100 | #299 | Tragic $72,856 |
| Immigrants | Dominica | 0.0 /100 | #300 | Tragic $72,760 |
| Cherokee | 0.0 /100 | #301 | Tragic $72,682 |
| Shoshone | 0.0 /100 | #302 | Tragic $72,660 |
| Africans | 0.0 /100 | #303 | Tragic $72,650 |
| Immigrants | Haiti | 0.0 /100 | #304 | Tragic $72,599 |
| Hondurans | 0.0 /100 | #305 | Tragic $72,588 |
| Potawatomi | 0.0 /100 | #306 | Tragic $72,576 |
| Ute | 0.0 /100 | #307 | Tragic $72,402 |
| Yakama | 0.0 /100 | #308 | Tragic $72,225 |
| Immigrants | Caribbean | 0.0 /100 | #309 | Tragic $71,860 |
| U.S. Virgin Islanders | 0.0 /100 | #310 | Tragic $71,853 |
| Immigrants | Zaire | 0.0 /100 | #311 | Tragic $71,801 |