Salvadoran vs Immigrants from Mexico Median Household Income
COMPARE
Salvadoran
Immigrants from Mexico
Median Household Income
Median Household Income Comparison
Salvadorans
Immigrants from Mexico
$82,449
MEDIAN HOUSEHOLD INCOME
15.4/ 100
METRIC RATING
211th/ 347
METRIC RANK
$73,160
MEDIAN HOUSEHOLD INCOME
0.0/ 100
METRIC RATING
297th/ 347
METRIC RANK
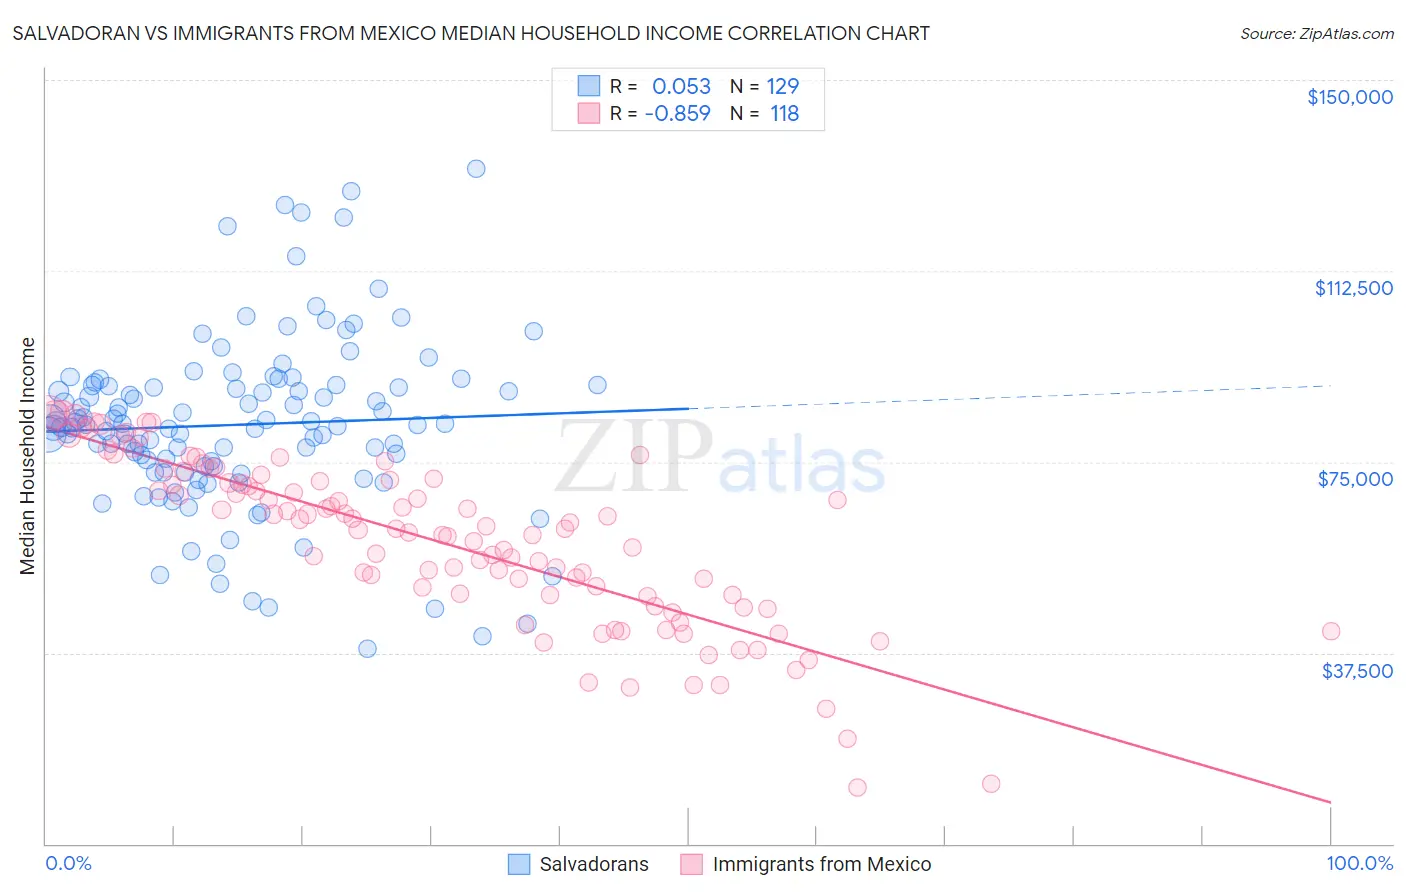
Salvadoran vs Immigrants from Mexico Median Household Income Correlation Chart
The statistical analysis conducted on geographies consisting of 398,609,851 people shows a slight positive correlation between the proportion of Salvadorans and median household income in the United States with a correlation coefficient (R) of 0.053 and weighted average of $82,449. Similarly, the statistical analysis conducted on geographies consisting of 513,131,801 people shows a very strong negative correlation between the proportion of Immigrants from Mexico and median household income in the United States with a correlation coefficient (R) of -0.859 and weighted average of $73,160, a difference of 12.7%.
Median Household Income Correlation Summary
| Measurement | Salvadoran | Immigrants from Mexico |
| Minimum | $38,281 | $11,125 |
| Maximum | $132,625 | $84,609 |
| Range | $94,344 | $73,484 |
| Mean | $82,302 | $59,423 |
| Median | $82,350 | $61,801 |
| Interquartile 25% (IQ1) | $73,617 | $48,735 |
| Interquartile 75% (IQ3) | $90,029 | $71,471 |
| Interquartile Range (IQR) | $16,412 | $22,736 |
| Standard Deviation (Sample) | $17,071 | $16,352 |
| Standard Deviation (Population) | $17,005 | $16,282 |
Similar Demographics by Median Household Income
Demographics Similar to Salvadorans by Median Household Income
In terms of median household income, the demographic groups most similar to Salvadorans are Venezuelan ($82,432, a difference of 0.020%), Nepalese ($82,410, a difference of 0.050%), Immigrants from Uruguay ($82,560, a difference of 0.14%), Immigrants from Iraq ($82,594, a difference of 0.18%), and Panamanian ($82,272, a difference of 0.22%).
| Demographics | Rating | Rank | Median Household Income |
| Immigrants | Africa | 23.8 /100 | #204 | Fair $83,289 |
| Celtics | 22.7 /100 | #205 | Fair $83,193 |
| Immigrants | Kenya | 21.3 /100 | #206 | Fair $83,068 |
| Dutch | 20.3 /100 | #207 | Fair $82,971 |
| French Canadians | 18.7 /100 | #208 | Poor $82,810 |
| Immigrants | Iraq | 16.7 /100 | #209 | Poor $82,594 |
| Immigrants | Uruguay | 16.4 /100 | #210 | Poor $82,560 |
| Salvadorans | 15.4 /100 | #211 | Poor $82,449 |
| Venezuelans | 15.3 /100 | #212 | Poor $82,432 |
| Nepalese | 15.1 /100 | #213 | Poor $82,410 |
| Panamanians | 14.0 /100 | #214 | Poor $82,272 |
| Vietnamese | 13.8 /100 | #215 | Poor $82,248 |
| Yugoslavians | 13.3 /100 | #216 | Poor $82,186 |
| Ecuadorians | 12.5 /100 | #217 | Poor $82,070 |
| Whites/Caucasians | 12.2 /100 | #218 | Poor $82,029 |
Demographics Similar to Immigrants from Mexico by Median Household Income
In terms of median household income, the demographic groups most similar to Immigrants from Mexico are Haitian ($73,306, a difference of 0.20%), Paiute ($72,959, a difference of 0.27%), Cuban ($73,392, a difference of 0.32%), Indonesian ($72,856, a difference of 0.42%), and Blackfeet ($73,509, a difference of 0.48%).
| Demographics | Rating | Rank | Median Household Income |
| Bangladeshis | 0.1 /100 | #290 | Tragic $74,112 |
| Hispanics or Latinos | 0.1 /100 | #291 | Tragic $73,823 |
| Comanche | 0.1 /100 | #292 | Tragic $73,747 |
| Immigrants | Cabo Verde | 0.1 /100 | #293 | Tragic $73,515 |
| Blackfeet | 0.1 /100 | #294 | Tragic $73,509 |
| Cubans | 0.1 /100 | #295 | Tragic $73,392 |
| Haitians | 0.1 /100 | #296 | Tragic $73,306 |
| Immigrants | Mexico | 0.0 /100 | #297 | Tragic $73,160 |
| Paiute | 0.0 /100 | #298 | Tragic $72,959 |
| Indonesians | 0.0 /100 | #299 | Tragic $72,856 |
| Immigrants | Dominica | 0.0 /100 | #300 | Tragic $72,760 |
| Cherokee | 0.0 /100 | #301 | Tragic $72,682 |
| Shoshone | 0.0 /100 | #302 | Tragic $72,660 |
| Africans | 0.0 /100 | #303 | Tragic $72,650 |
| Immigrants | Haiti | 0.0 /100 | #304 | Tragic $72,599 |