Ethiopian vs Immigrants from Caribbean Median Household Income
COMPARE
Ethiopian
Immigrants from Caribbean
Median Household Income
Median Household Income Comparison
Ethiopians
Immigrants from Caribbean
$89,640
MEDIAN HOUSEHOLD INCOME
94.9/ 100
METRIC RATING
121st/ 347
METRIC RANK
$71,860
MEDIAN HOUSEHOLD INCOME
0.0/ 100
METRIC RATING
309th/ 347
METRIC RANK
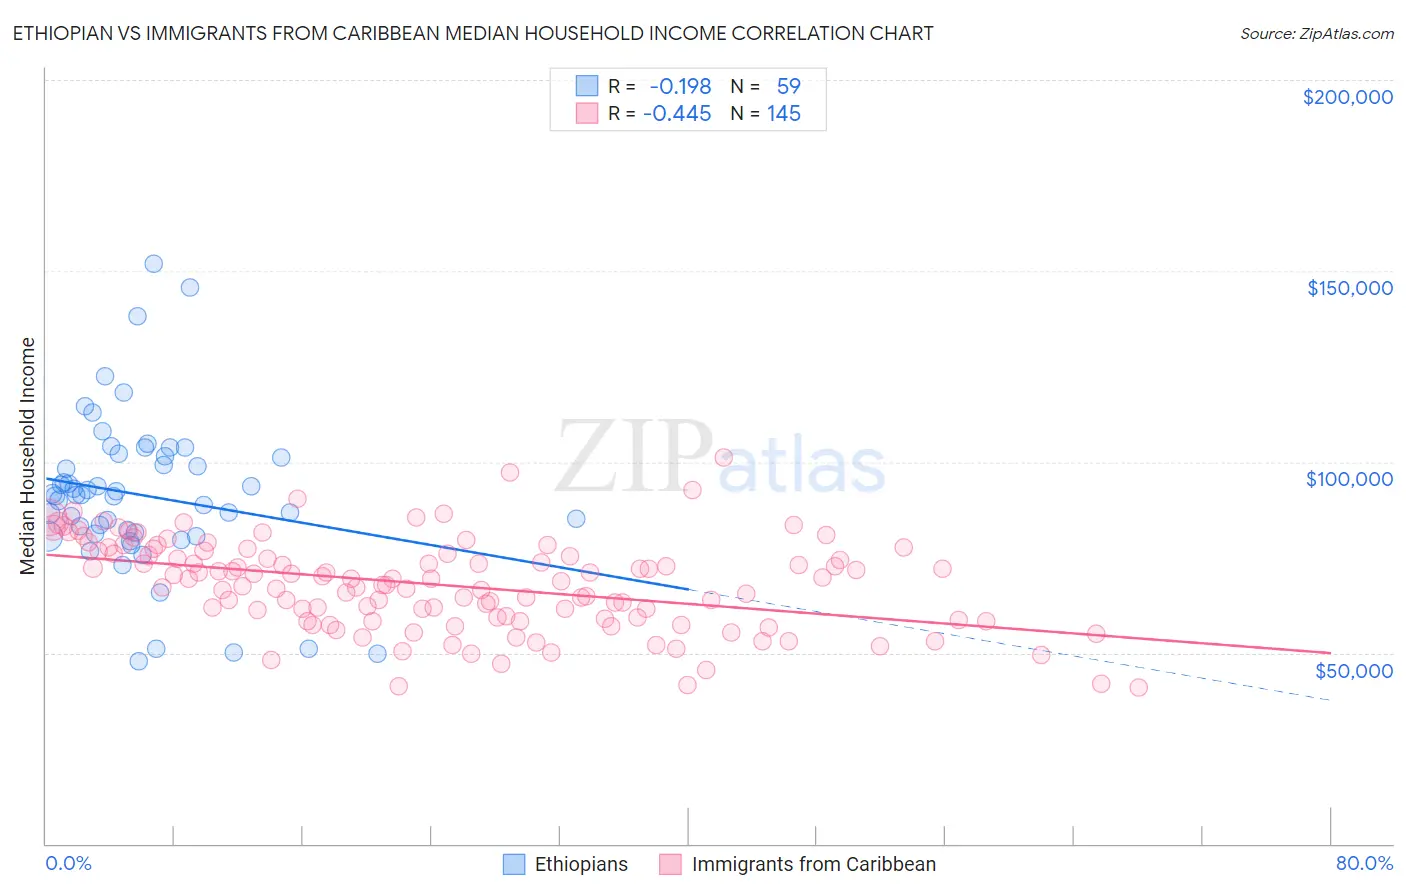
Ethiopian vs Immigrants from Caribbean Median Household Income Correlation Chart
The statistical analysis conducted on geographies consisting of 223,045,474 people shows a poor negative correlation between the proportion of Ethiopians and median household income in the United States with a correlation coefficient (R) of -0.198 and weighted average of $89,640. Similarly, the statistical analysis conducted on geographies consisting of 449,492,713 people shows a moderate negative correlation between the proportion of Immigrants from Caribbean and median household income in the United States with a correlation coefficient (R) of -0.445 and weighted average of $71,860, a difference of 24.7%.
Median Household Income Correlation Summary
| Measurement | Ethiopian | Immigrants from Caribbean |
| Minimum | $47,668 | $41,053 |
| Maximum | $151,943 | $101,042 |
| Range | $104,275 | $59,989 |
| Mean | $91,215 | $67,787 |
| Median | $91,248 | $68,717 |
| Interquartile 25% (IQ1) | $81,124 | $58,750 |
| Interquartile 75% (IQ3) | $101,374 | $76,359 |
| Interquartile Range (IQR) | $20,250 | $17,609 |
| Standard Deviation (Sample) | $20,515 | $11,824 |
| Standard Deviation (Population) | $20,340 | $11,783 |
Similar Demographics by Median Household Income
Demographics Similar to Ethiopians by Median Household Income
In terms of median household income, the demographic groups most similar to Ethiopians are Pakistani ($89,638, a difference of 0.0%), Immigrants from North Macedonia ($89,741, a difference of 0.11%), Albanian ($89,744, a difference of 0.12%), Immigrants from Zimbabwe ($89,496, a difference of 0.16%), and Syrian ($89,830, a difference of 0.21%).
| Demographics | Rating | Rank | Median Household Income |
| Immigrants | Northern Africa | 95.9 /100 | #114 | Exceptional $90,026 |
| Immigrants | Western Asia | 95.9 /100 | #115 | Exceptional $90,005 |
| Native Hawaiians | 95.7 /100 | #116 | Exceptional $89,919 |
| Taiwanese | 95.6 /100 | #117 | Exceptional $89,900 |
| Syrians | 95.4 /100 | #118 | Exceptional $89,830 |
| Albanians | 95.2 /100 | #119 | Exceptional $89,744 |
| Immigrants | North Macedonia | 95.2 /100 | #120 | Exceptional $89,741 |
| Ethiopians | 94.9 /100 | #121 | Exceptional $89,640 |
| Pakistanis | 94.8 /100 | #122 | Exceptional $89,638 |
| Immigrants | Zimbabwe | 94.4 /100 | #123 | Exceptional $89,496 |
| Immigrants | Jordan | 94.1 /100 | #124 | Exceptional $89,412 |
| Immigrants | Kuwait | 93.5 /100 | #125 | Exceptional $89,263 |
| Immigrants | Oceania | 92.9 /100 | #126 | Exceptional $89,100 |
| Immigrants | Peru | 92.5 /100 | #127 | Exceptional $89,010 |
| Portuguese | 92.3 /100 | #128 | Exceptional $88,976 |
Demographics Similar to Immigrants from Caribbean by Median Household Income
In terms of median household income, the demographic groups most similar to Immigrants from Caribbean are U.S. Virgin Islander ($71,853, a difference of 0.010%), Immigrants from Zaire ($71,801, a difference of 0.080%), Yakama ($72,225, a difference of 0.51%), Immigrants from Honduras ($71,452, a difference of 0.57%), and Immigrants from Bahamas ($71,349, a difference of 0.72%).
| Demographics | Rating | Rank | Median Household Income |
| Shoshone | 0.0 /100 | #302 | Tragic $72,660 |
| Africans | 0.0 /100 | #303 | Tragic $72,650 |
| Immigrants | Haiti | 0.0 /100 | #304 | Tragic $72,599 |
| Hondurans | 0.0 /100 | #305 | Tragic $72,588 |
| Potawatomi | 0.0 /100 | #306 | Tragic $72,576 |
| Ute | 0.0 /100 | #307 | Tragic $72,402 |
| Yakama | 0.0 /100 | #308 | Tragic $72,225 |
| Immigrants | Caribbean | 0.0 /100 | #309 | Tragic $71,860 |
| U.S. Virgin Islanders | 0.0 /100 | #310 | Tragic $71,853 |
| Immigrants | Zaire | 0.0 /100 | #311 | Tragic $71,801 |
| Immigrants | Honduras | 0.0 /100 | #312 | Tragic $71,452 |
| Immigrants | Bahamas | 0.0 /100 | #313 | Tragic $71,349 |
| Dominicans | 0.0 /100 | #314 | Tragic $71,302 |
| Ottawa | 0.0 /100 | #315 | Tragic $70,984 |
| Apache | 0.0 /100 | #316 | Tragic $70,927 |