Ethiopian vs Scottish Median Household Income
COMPARE
Ethiopian
Scottish
Median Household Income
Median Household Income Comparison
Ethiopians
Scottish
$89,640
MEDIAN HOUSEHOLD INCOME
94.9/ 100
METRIC RATING
121st/ 347
METRIC RANK
$85,101
MEDIAN HOUSEHOLD INCOME
50.0/ 100
METRIC RATING
174th/ 347
METRIC RANK
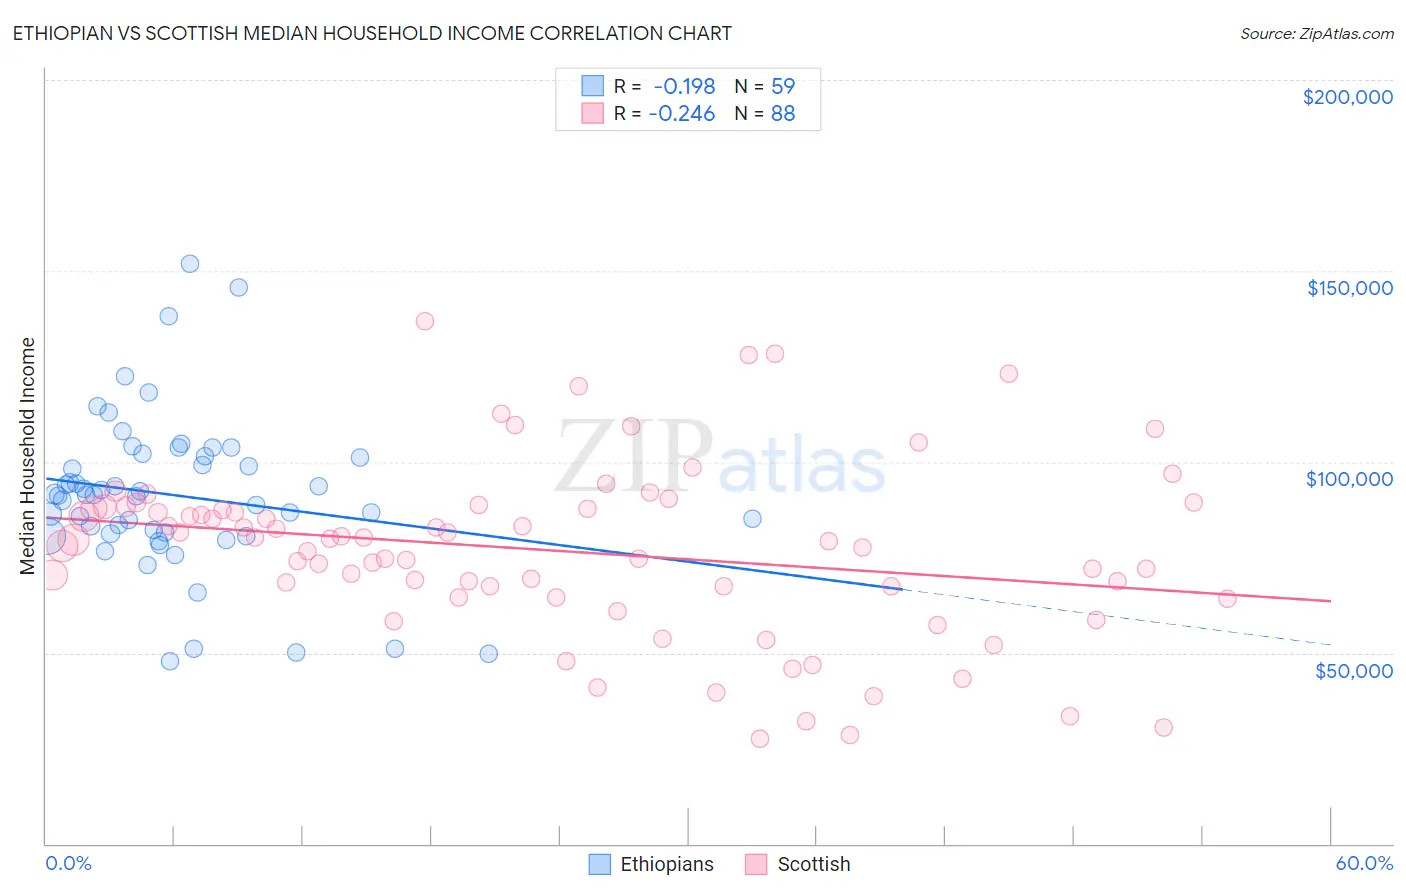
Ethiopian vs Scottish Median Household Income Correlation Chart
The statistical analysis conducted on geographies consisting of 223,045,474 people shows a poor negative correlation between the proportion of Ethiopians and median household income in the United States with a correlation coefficient (R) of -0.198 and weighted average of $89,640. Similarly, the statistical analysis conducted on geographies consisting of 566,054,944 people shows a weak negative correlation between the proportion of Scottish and median household income in the United States with a correlation coefficient (R) of -0.246 and weighted average of $85,101, a difference of 5.3%.
Median Household Income Correlation Summary
| Measurement | Ethiopian | Scottish |
| Minimum | $47,668 | $27,500 |
| Maximum | $151,943 | $136,980 |
| Range | $104,275 | $109,480 |
| Mean | $91,215 | $76,735 |
| Median | $91,248 | $79,406 |
| Interquartile 25% (IQ1) | $81,124 | $65,944 |
| Interquartile 75% (IQ3) | $101,374 | $88,035 |
| Interquartile Range (IQR) | $20,250 | $22,091 |
| Standard Deviation (Sample) | $20,515 | $22,770 |
| Standard Deviation (Population) | $20,340 | $22,640 |
Similar Demographics by Median Household Income
Demographics Similar to Ethiopians by Median Household Income
In terms of median household income, the demographic groups most similar to Ethiopians are Pakistani ($89,638, a difference of 0.0%), Immigrants from North Macedonia ($89,741, a difference of 0.11%), Albanian ($89,744, a difference of 0.12%), Immigrants from Zimbabwe ($89,496, a difference of 0.16%), and Syrian ($89,830, a difference of 0.21%).
| Demographics | Rating | Rank | Median Household Income |
| Immigrants | Northern Africa | 95.9 /100 | #114 | Exceptional $90,026 |
| Immigrants | Western Asia | 95.9 /100 | #115 | Exceptional $90,005 |
| Native Hawaiians | 95.7 /100 | #116 | Exceptional $89,919 |
| Taiwanese | 95.6 /100 | #117 | Exceptional $89,900 |
| Syrians | 95.4 /100 | #118 | Exceptional $89,830 |
| Albanians | 95.2 /100 | #119 | Exceptional $89,744 |
| Immigrants | North Macedonia | 95.2 /100 | #120 | Exceptional $89,741 |
| Ethiopians | 94.9 /100 | #121 | Exceptional $89,640 |
| Pakistanis | 94.8 /100 | #122 | Exceptional $89,638 |
| Immigrants | Zimbabwe | 94.4 /100 | #123 | Exceptional $89,496 |
| Immigrants | Jordan | 94.1 /100 | #124 | Exceptional $89,412 |
| Immigrants | Kuwait | 93.5 /100 | #125 | Exceptional $89,263 |
| Immigrants | Oceania | 92.9 /100 | #126 | Exceptional $89,100 |
| Immigrants | Peru | 92.5 /100 | #127 | Exceptional $89,010 |
| Portuguese | 92.3 /100 | #128 | Exceptional $88,976 |
Demographics Similar to Scottish by Median Household Income
In terms of median household income, the demographic groups most similar to Scottish are Immigrants from Costa Rica ($85,054, a difference of 0.050%), Alsatian ($85,053, a difference of 0.060%), Immigrants from Eritrea ($85,025, a difference of 0.090%), Czechoslovakian ($84,965, a difference of 0.16%), and English ($84,915, a difference of 0.22%).
| Demographics | Rating | Rank | Median Household Income |
| Immigrants | Immigrants | 61.3 /100 | #167 | Good $85,818 |
| Icelanders | 61.0 /100 | #168 | Good $85,797 |
| Colombians | 59.7 /100 | #169 | Average $85,716 |
| Swiss | 59.2 /100 | #170 | Average $85,681 |
| Immigrants | South America | 58.1 /100 | #171 | Average $85,611 |
| Slovenes | 57.4 /100 | #172 | Average $85,562 |
| Immigrants | Cameroon | 53.4 /100 | #173 | Average $85,314 |
| Scottish | 50.0 /100 | #174 | Average $85,101 |
| Immigrants | Costa Rica | 49.2 /100 | #175 | Average $85,054 |
| Alsatians | 49.2 /100 | #176 | Average $85,053 |
| Immigrants | Eritrea | 48.8 /100 | #177 | Average $85,025 |
| Czechoslovakians | 47.8 /100 | #178 | Average $84,965 |
| English | 47.0 /100 | #179 | Average $84,915 |
| Immigrants | Portugal | 44.2 /100 | #180 | Average $84,740 |
| Hawaiians | 44.1 /100 | #181 | Average $84,729 |